The Conductor, a documentary film, follows the persistent path of renowned conductor Marin Alsop as she battles her way to become the first prominent female conductor. Her hard work, flexibility, and problem-solving inspire us. Alsop, about conducting Gustav Mahler’s work, says: “It’s a large-scale journey, guaranteed to provide surprises and new discoveries along the way.” Legend has it that two wildly contrasting events from Mahler’s life heavily influenced the wide-ranging sentiments of his Symphony No. 5. While composing the piece, he endured the agony of a near-death experience as well as the joy of meeting the woman who became his wife.
Investors face similarly disparate complicated and contrasting events. Consider one of the best periods ever for the job market contrasted with inflation, experiencing one of its worst periods ever. These discordant economic themes create a fraught investment soundscape. War, a pandemic, and government policy each caused this tumult. Amidst the din, we advise investors to extend timelines, stay diversified, and focus on individual stock selection. Great companies will produce superb results over time as they succeed in balancing a slew of macroeconomic challenges.
War—An Unpredictable Event with an Uncertain End Date
The Ukraine war has further disrupted the global oil market, where supply was already suppressed by the financial discipline of energy companies as well as environmental and regulatory pressures. The war’s damage to Ukrainian wheat and farming-related commodities will likely cause higher food prices in Europe, and perhaps globally. The United States Department of Agriculture (USDA) notes the importance of wheat, corn, barley, and sunflower oil exports from Russia and Ukraine to global agricultural markets. Many of these exports go to countries other than the United States since the U.S. produces and exports both corn and wheat. This provides an example of the conflicting signals emitted during a confusing time. Global agricultural commodity prices have increased significantly, causing economic stress in some countries and contributing to global inflation. The effects are more mixed domestically as higher food prices drive higher revenues for farmers who also face higher energy and fertilizer costs.
The war’s end game is unpredictable, and time’s passage will increase pressure for a resolution over an unknown period. Faced with uncertainty, wise investors think across quarters and years, rather than anticipating daily or weekly war news.
The Pandemic—Almost Over, But Not Quite
While the pandemic has become endemic, conditions are not fully back to normal. The aftermath of massive labor and staffing disruptions is still felt throughout supply chains. Semiconductors and autos are two prominent examples, along with long order times and inventory management challenges. Problems seem to be easing; metrics tracking shipping and trucking congestion show improvement.
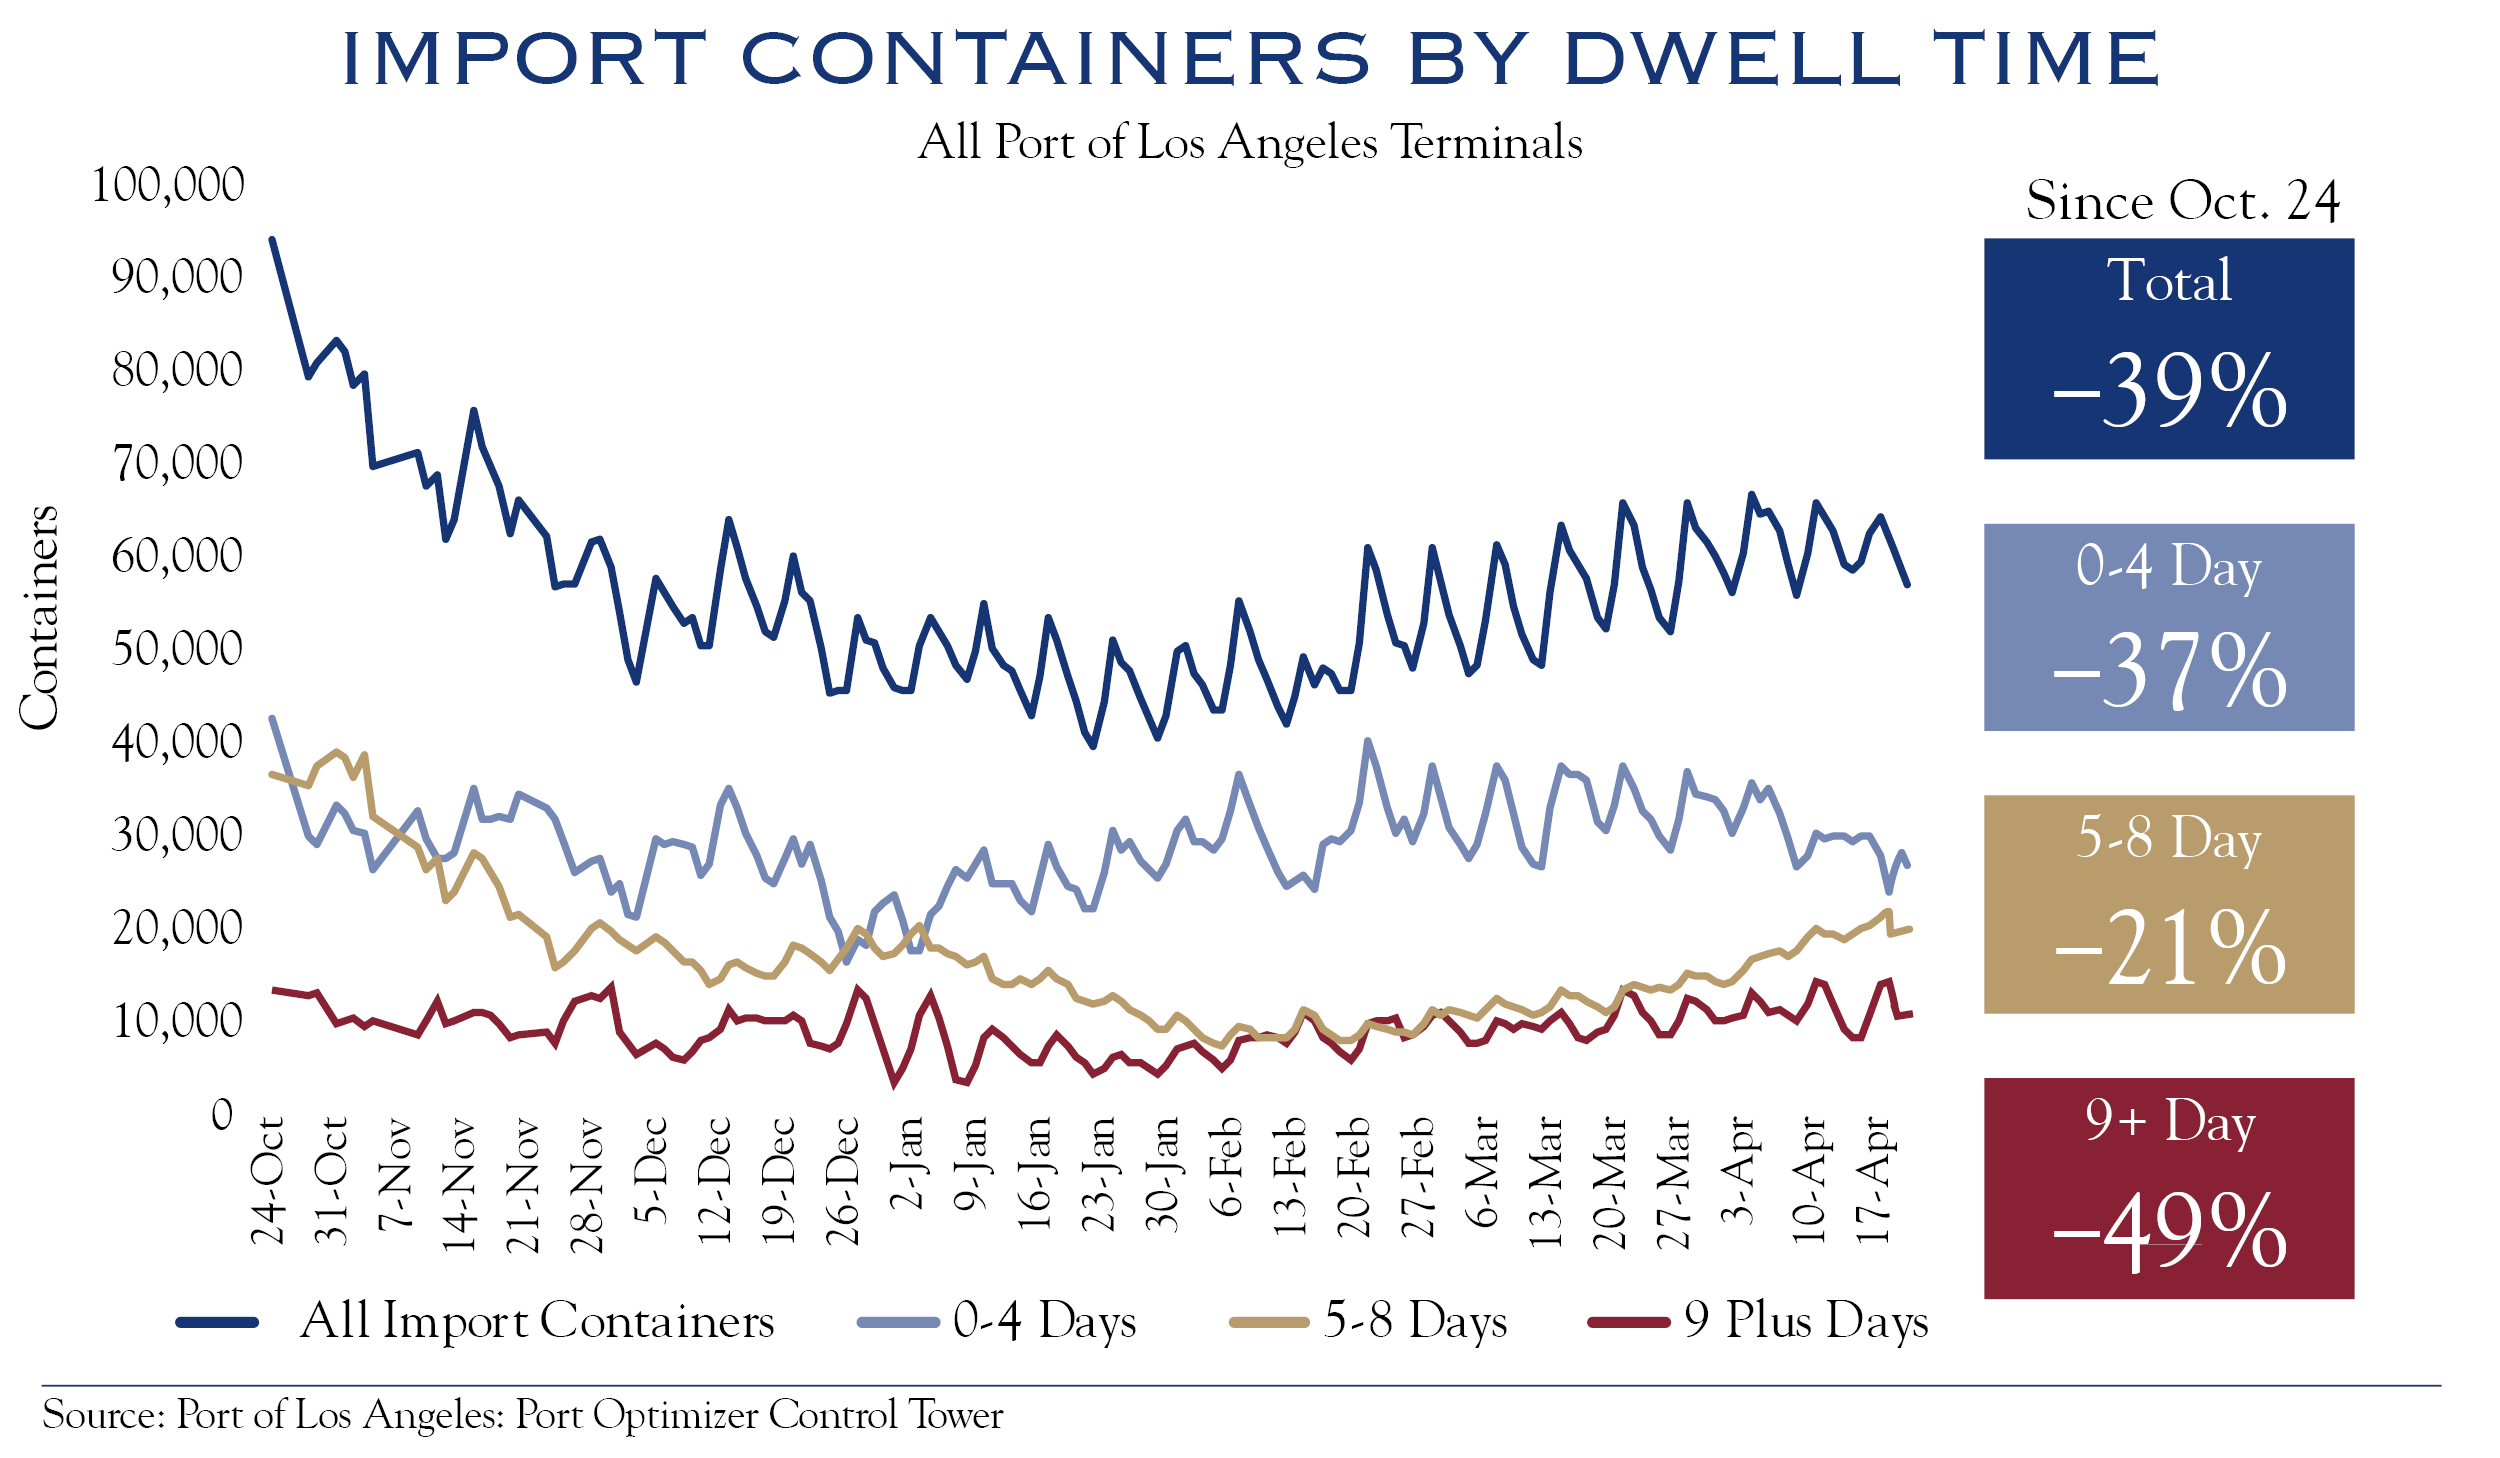
Container Ships
The Port of Los Angeles showed a decline in the number of container ships dwelling for more than nine days. This figure is down ‚àí49% from peak port congestion in October.
Trucking
DAT Freight & Analytics painted a mixed picture across segments in trucking. Industrial demand is at normal seasonal strength, while consumer-type demand seems to be cooling. This is consistent with the ongoing shift towards normalized consumer spending across goods and services.
Out and about—heating up or cooling down?
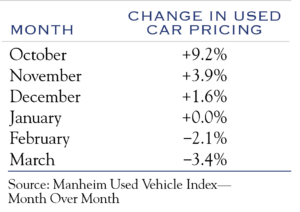
A surprisingly meaningful contributor to inflation—the price of used cars—started to cool.
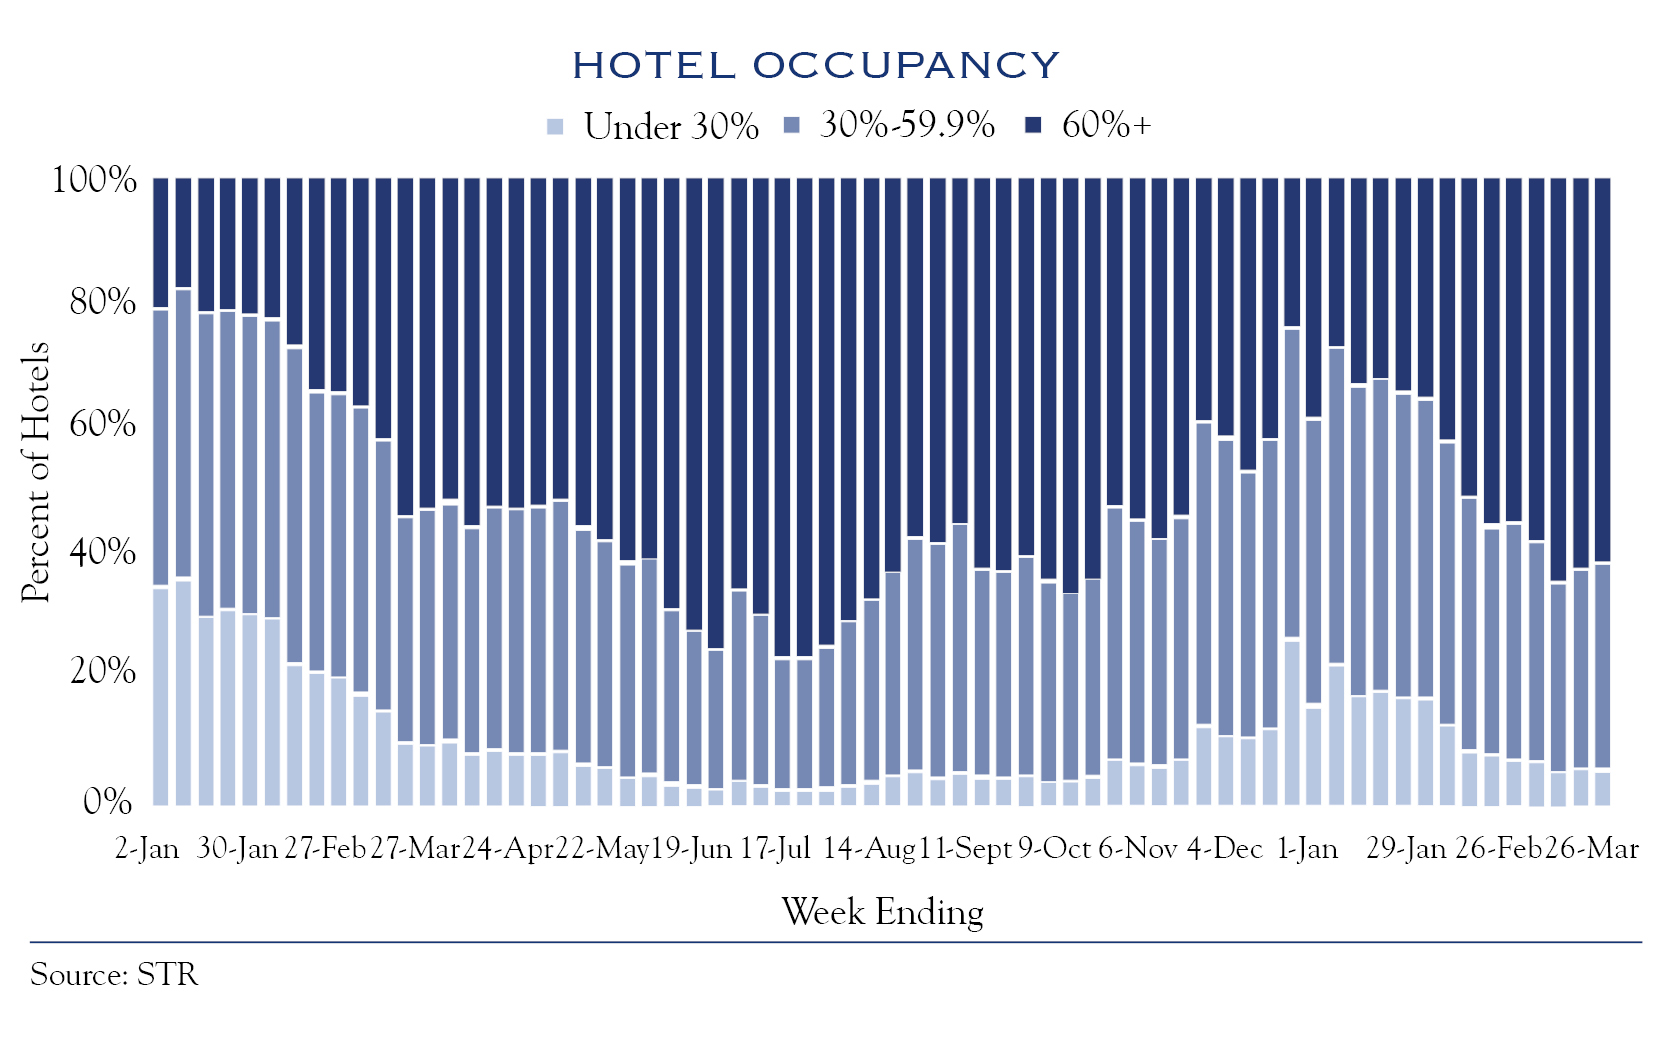
Travel-related prices are likely to increase due to heavy demand as we approach summer. STR reports hotel occupancy in U.S. Central Business District properties achieved pandemic-era highs in early April—an indication that business travel is re-emerging. Further, revenue per available room (RevPAR) across all hotel types has tracked higher than pre-pandemic levels in 2019.
The Crux Of China
China again has locked down cities, complicating recovery. Drawing on a number of direct contacts in Shanghai, we understand the situation to be challenging yet more sporadic than what the media widely reports. Many production facilities have implemented a “closed loop” system similar to the Olympics which restricts employees to a tight zone. The next few weeks will show whether these problems are contained or become more disruptive.
As with the war, the precise timeline of pandemic effects is unpredictable. Nonetheless, conditions continue to normalize across the economy. This will stabilize prices for most goods and services over time.
Policy—A New Era
Monetary and fiscal pandemic-era policies shifted spending patterns and increased consumption. While government spending remains robust, most specific consumer-facing programs have wound down. Monetary policies evolved from being wildly accommodative to more neutral as the Fed halted purchasing bonds and began a likely sequence of rate hikes. The Fed has made it clear that it now brings an appropriate level of seriousness to combatting inflation. Rate hikes will continue until conditions change—either until inflation abates or policy fully normalizes. The Fed’s pace to allow bonds to mature, or the amount of securities it will sell, remains unclear. Either way, the Fed’s initial rate hike and signaling effect have flowed through the lending market. Mortgage rates quickly rose from 2.65% to 5.11%. These rate increases will have the most bite in the housing market, causing home affordability to decline, in turn likely cooling the rapid rate of rising house prices. Similarly, credit availability and bank lending standards will likely tighten, dampening economic activity. Both effects should help moderate housing-related inflation.
The Yield Curve Inversion—It’s Complicated
The yield curve, a common focal point for economic forecasting, has garnered a lot of renewed attention. Many believe an inverted yield curve, where short-term rates exceed long-term rates, indicates a near-term economic slowdown. The idea is that future interest rates lower than current rates imply a slower future economy. Five of six prior yield inversions were followed by a recession. Yet, this indicator is useless with respect to both the timing of a slowdown or a stock market direction. The time from inversion to recession has been, on average, about 20 months—ranging 10-33 months. If we take the indicator at historical precedent, it implies an 83% chance (5 in 6 times) of suffering a recession by approximately Q1 2024. Even if that were the case, a recession does not equal a depression or financial market crisis! Is it possible that there will be two consecutive quarters of negative GDP growth in 2024? Of course. So maybe the indicator will work. As for equity markets of concern to investors: the time from inversion to a peak in prices averages 14 months, ranging 6-25 months, while the average gain is +19%—ranging +7%-34%. That’s a lot of potential lost opportunity.
Another take on the yield inversion comes from Tom Lee of FundStrat research. He creates a “real” yield curve, after considering inflation, which has not inverted. His point is that the inflation curve (very high up front, lower further out) is a distortion that does not typically occur alongside typical inversions. Thus, the current inverted yield curve is caused more by inflation and expected Fed policy than by the bond market predicting a recession.
While headlines scream “recession is coming,” the details are more nuanced. An inverted yield curve does not produce much actionable information for predicting the timing or magnitude of a recession, or for market direction. It may be a useful signal that economic growth will slow at some point—potentially 6-8 quarters from now. This interpretation is consistent with our view of above-average growth (COVID recovery, job recovery) for a few more quarters, followed by a return to normal economic growth of roughly 2%. It would not take much to induce a recession when the economy is back to normal and growing slowly, though that condition is unlikely for multiple quarters.
U.S. Economic Growth: New York vs. Atlanta
With professional baseball underway, the Mets and the Braves will be battling it out on the baseball diamond. Similarly, the New York Fed and the Atlanta Fed have dueling economic forecasts with wide divergences in their economic outlooks. The GDP Now model from the Atlanta Fed expects economic growth of approximately +1.32%, while the New York Fed’s Weekly Economic forecast is +4.47%.
The Atlanta Fed uses a model based on more traditional indicators which use historical correlations to economic growth. A few inputs include net exports, monthly change in consumer spending, and residential investment. The New York Fed model was developed during the pandemic to assess “real time” indicators of current economic activity. These inputs include weekly retail sales figures from major retailers, tax receipts, steel production, and electricity usage. Our view aligns more closely with our neighbors in New York, and we anticipate stronger than average (above 2%) GDP growth in coming quarters.
We partly base our view on the incredibly strong job market. As pandemic conditions ease, more workers are returning to the labor force. Participation rates have climbed from 61.5% in March 2021 to 62.4% in March 2022, not back to the pre-pandemic level of 63.0% but moving in the right direction. There are 150.9 million workers currently employed, which is near the peak of 152.0 million in February 2020. We have seen a 3.6% unemployment rate and an average creation of 500 thousand new jobs over the last three months. Lastly, and quite importantly, jobs on offer are 11.3 million. The primary growth in the economy comes from jobs, so these facts indicate a strong economic backdrop.
Productivity is another key contributor to economic growth. While productivity is notoriously difficult to measure, the size of the economy (GDP) relative to the total number of workers employed provides a simple metric. Long-run economic growth is closely tied to increases in population and productivity gain—especially in a working population since economic output is generated by each worker. Currently, the U.S. economy is 3% larger than its pre-pandemic state, even though the total number of workers employed remains below peak employment. This indicates that companies are discovering ways to optimize production.
Some commentators have expressed concern that the tight labor market will lead to a “wage-price” spiral, whereby labor costs increase and cause companies to raise prices, which in turn causes workers to demand raises. Our view is that productivity, as well as the potential for labor substitution (artificial intelligence and robots), will limit any wage-price spiral inflation. In fact, only a few years ago markets were concerned that artificial intelligence and robots would take over all jobs. We do not believe that scenario will materialize. Robots, however, are making major inroads.
The March 31, 2022, issue of BusinessWeek revealed that companies offer robotic labor as a subscription service, with some plans costing “as little as $8 an hour.” Robot Subscription Services Let Companies Automate on the Cheap. The U.S. manufacturing industry currently ranks sixth globally. The emergence of “robot-as-a-service” frees the end user of the capital requirements and commitment needed to establish robots in the workforce. This will open the availability of robotic technology to a larger number of companies.
The restaurant industry has begun leveraging tech-labor substitutes such as digital ordering tablets: customers can order and pay through the app versus speaking with waitstaff. The only human interaction customers experience is with the food delivery and table-bussing process. Whether or not this is preferable is a matter of style, yet there is no doubt that it offsets the amount of labor needed. One can easily imagine how higher hourly wages for labor might not result in higher overall labor costs.
Artificial intelligence is revolutionizing task performance across functions, including algorithms that provide employees with virtual assistants to help with everyday administrative tasks, reducing the need for additional bodies. Gartner Group estimates that by 2024, “75% of enterprises will shift from piloting to operationalizing AI.” While specific outcomes are not knowable, trends point towards continued productivity gains. This often occurs following a crisis.
Productivity can also be seen in expanding corporate profit margins. Sixty-five percent (65%) of companies in the Russell 1000 Index are above their three-year average profit margins, despite numerous challenges with staffing, the pandemic, and rising input costs.
With a strong labor market and good productivity, we anticipate that above-average economic growth will continue.
Inflation
Starting first with the bad news: inflation remains stubbornly high, with the most recent CPI reading showing a gain in prices of +8.5%.
Increased energy costs were a large contributor. Those energy costs may not climb higher, but they are likely to remain elevated as long as Russian oil is not replaced with production elsewhere. Forecasting commodity prices is particularly onerous; nevertheless, we expect energy costs to stabilize and eventually decline as additional production comes onboard, and energy efficiencies continue to improve.
Pandemic-influenced goods comprise another basket of increased prices. Supply limitations and price increases of new and used cars, as well as semiconductors, have caused severe disruptions in shipping and labor participation. While recovery won’t be immediate, what goes up must come down, especially if what led prices up was the rapid economic cycle caused by COVID. Early signs of improvement are apparent in the downtick of used vehicle prices and marginal improvements in supply chain stress.
CPI is measured on a year-over-year basis. For example, the +8.5% CPI figure from March 2022 is relative to March of 2021. This base effect is beginning to change; figures in April 2021 represent one of the first months of the inflation surge. In other words, each month going forward, inflation will be clearing a higher bar, naturally bringing down the measured rate of inflation.
Shelter represents approximately 33% of CPI and has been increasing around 4%; it is likely to continue at that pace. It appeared housing costs might accelerate as home buying strengthened due to low interest rates and pandemic-era moves. With mortgage rates ticking higher and mortgage applications predictably trending lower, we expect the house price surge to moderate and remain near current levels for CPI purposes.
None of this offers any comfort to anyone observing prices at the pump for gasoline. However, the portion of budget expenditure related to energy has declined over time and is significantly lower than prior periods of elevated energy costs. For this reason, we do not believe higher energy costs are likely to trigger a recession.
Inflation is a multi-headed beast and will not be easy to slay. We expect readings to remain high yet declining. Progress is being made in this battle, and markets will cheer any improvement in CPI in coming months.
Valuation/Earnings
Our outlook for investments in stocks and bonds gets back to basics. With such a noisy macroeconomic environment, we think investors should extend time horizons to allow the fundamentals to influence the movement of asset prices.
The war in Ukraine and lockdowns in China highlight the challenges of overseas investing. The advantages of the United States across policies, geography, technological leadership, and natural resources have become apparent. We continue to recommend modest exposure to non-U.S. equities for diversification benefits and to take advantage of reasonable valuations. However, the timeline for a convergence of valuations between the rest of the world and the U.S. is ambiguous.
Valuation levels for U.S. Equities remain elevated vs. long-term history yet remain below averages for the last ten years. While interest rates have risen, they remain historically low. We expect the macro environment to become less unsettled, and that valuations may improve, toward more recent averages.
Interest rates will continue to be influenced by Fed Policy, which we expect to remain aggressive in the near term. Longer term outlooks are cloudy and depend on the timeline for inflation cooling. We expect inflation readings will trend down (though still high) in the second half of 2022, giving the Fed some policy flexibility. We expect rates on the U.S. 10-Year to stabilize near current levels, as market expectations have mostly factored in an aggressive Fed rate hike policy. Yields are likely to reside in a wide range from 2%-3% amidst these varying influences and unusually active macroeconomic and geopolitical environments.
We expect stock prices to track earnings and expect 7% earnings growth rate across a three-year time frame. Our view is slightly more conservative than industry forecasts, since we foresee some companies struggling with the macro backdrop.
Lastly, we advocate active, individual stock selection. The economic environment favors the superior problem-solving abilities of management teams to heavily influence individual company success. In that environment, we expect stock selection to shine. The environment will remain volatile, so we encourage patience for the long term.
This communication contains the personal opinions, as of the date set forth herein, about the securities, investments and/or economic subjects discussed by Mr. Teeter. No part of Mr. Teeter’s compensation was, is or will be related to any specific views contained in these materials. This communication is intended for information purposes only and does not recommend or solicit the purchase or sale of specific securities or investment services. Readers should not infer or assume that any securities, sectors or markets described were or will be profitable or are appropriate to meet the objectives, situation or needs of a particular individual or family, as the implementation of any financial strategy should only be made after consultation with your attorney, tax advisor and investment advisor. Data for illustrations were sourced from Bloomberg, Port of Los Angeles: Port Optimizer Control Tower, STR, and Manheim Used Vehicle Index. All material presented is compiled from sources believed to be reliable, but accuracy or completeness cannot be guaranteed. © Silvercrest Asset Management Group LLC