Stocks are up a lot this year. Should they be, and where do we go from here?
The S&P 500 is up +10.56% year to date through March 31, partly due to higher valuations. The S&P 500 trades at 25x trailing 12-month earnings and 21x forward 12-month earnings. Those PE ratios have risen from 21x trailing and 19x forward just six months ago. In short, these higher prices factor in much good news.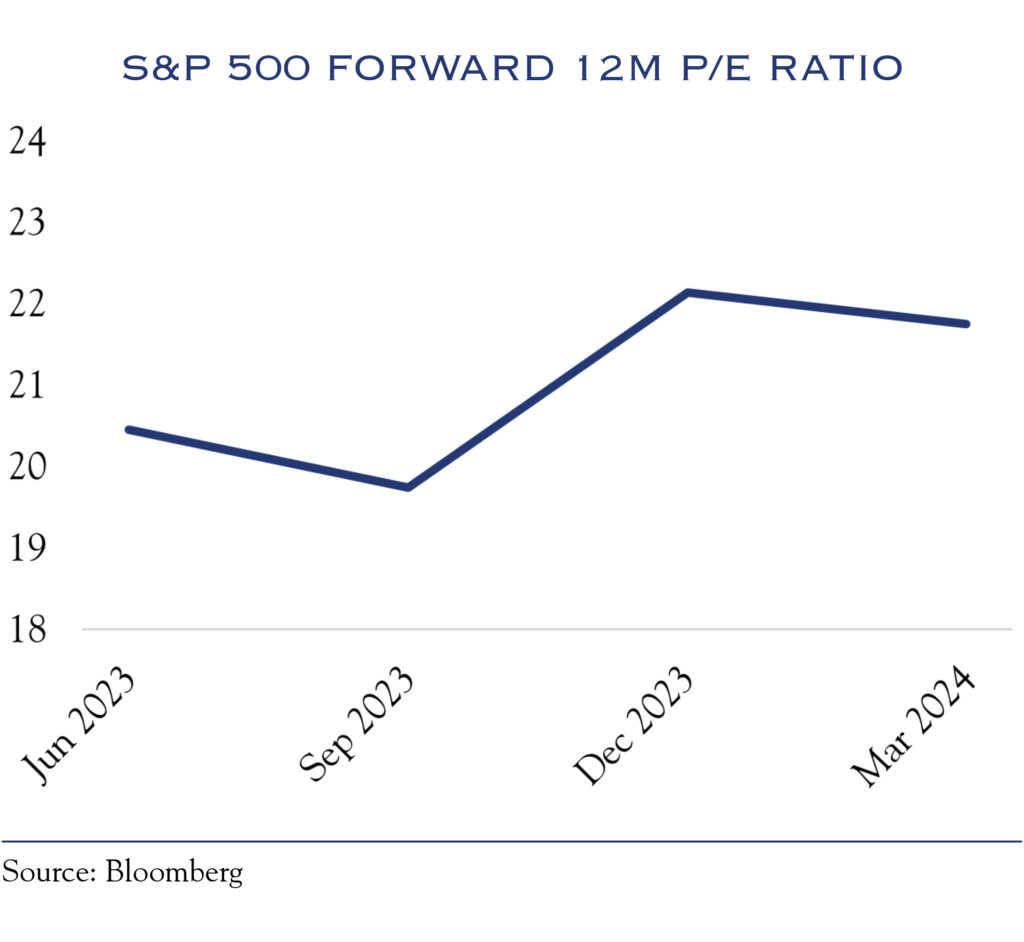
The rise in valuation levels coincides with an uptick in sentiment. A stronger-than-expected economy and moderating inflation have boosted sentiment in consumer surveys. Similarly, an improved outlook for interest rates has boosted investor sentiment. The AAII Sentiment Survey shows a “bullish” reading of 50%, above the 20–35% range for most of 2022 and 2023.
While valuations reflect reasonable assumptions for a stable economy, gradually improving inflation, and favorable Fed policy, they make the path ahead more challenging. As such, positive earnings momentum must come through to post further equity gains.
Although larger companies have led the rising market, gains elsewhere are starting to broaden. At quarter end, 329 of the companies comprising the S&P 500 posted positive returns for the quarter. Throughout the year, we expect earnings to deliver and gains to spread throughout a more significant segment of the equity market.
A Strong But Slowing Economy
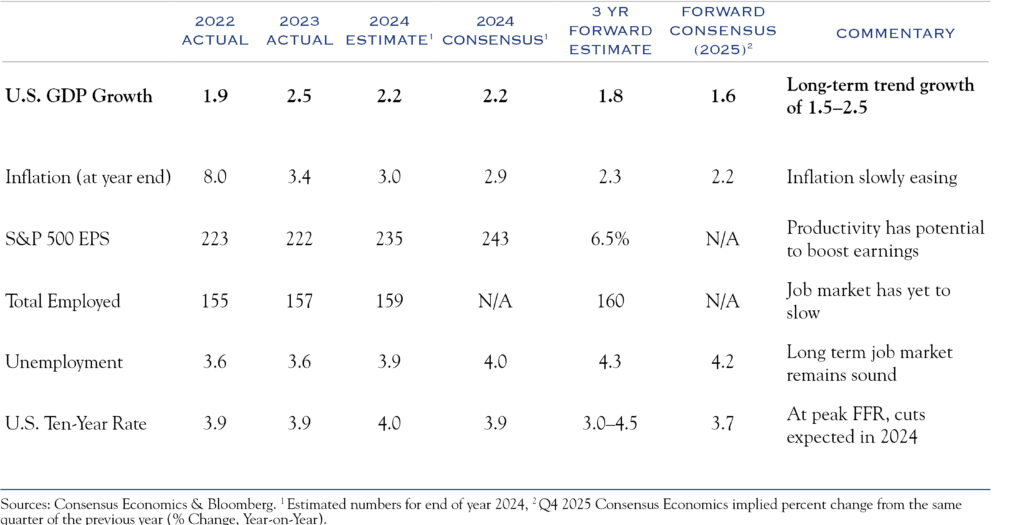
Two economic models from the Atlanta Fed (GDPNow) and the Dallas Fed (Weekly Economic Index) aim to measure the current level of growth in the economy. Both are pointing to solid economic growth, with GDPNow showing +2.8% and Weekly Economic Index showing +1.8%. With a long-term growth rate of 2.0% for the U.S. economy, these figures are reasonable and sustainable.
The Employment Situation
The expansion of payrolls and wages has played a key role in sustained economic growth. Both remain strong but are losing some momentum.
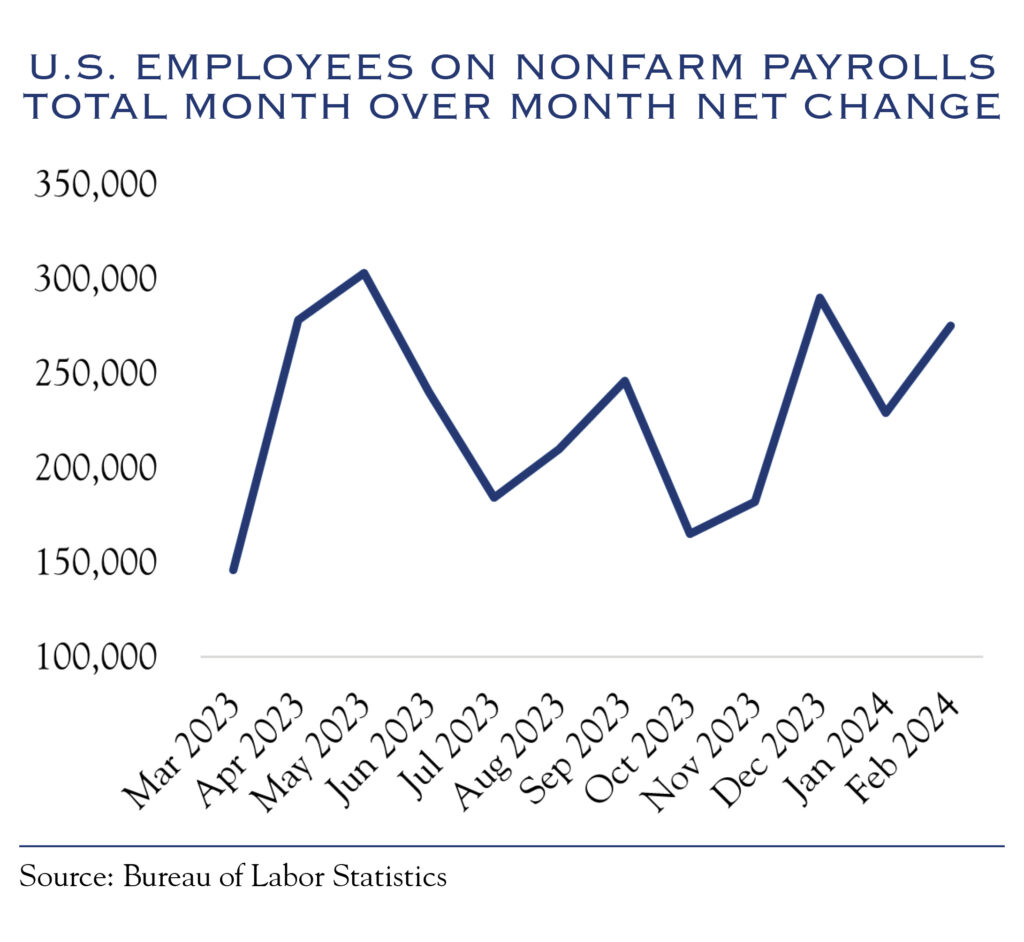
Employers continue to expand payrolls, with aggregate hiring in the economy creating an average of 275,000 new jobs per month over the past year. Over the past 15 years, job creation has averaged 136,000 new jobs per month.
Another bright spot for the consumer-powered economy is wages. They are growing at a brisk clip, with the Bureau of Labor Statistics (BLS) measuring the year-over-year gain at 4.3%, above the average of 3.0% over the last 15 years. Wage growth has been trending down over the past year, putting wage gains in a zone that is beneficial to the economy and not overly concerning for inflation.
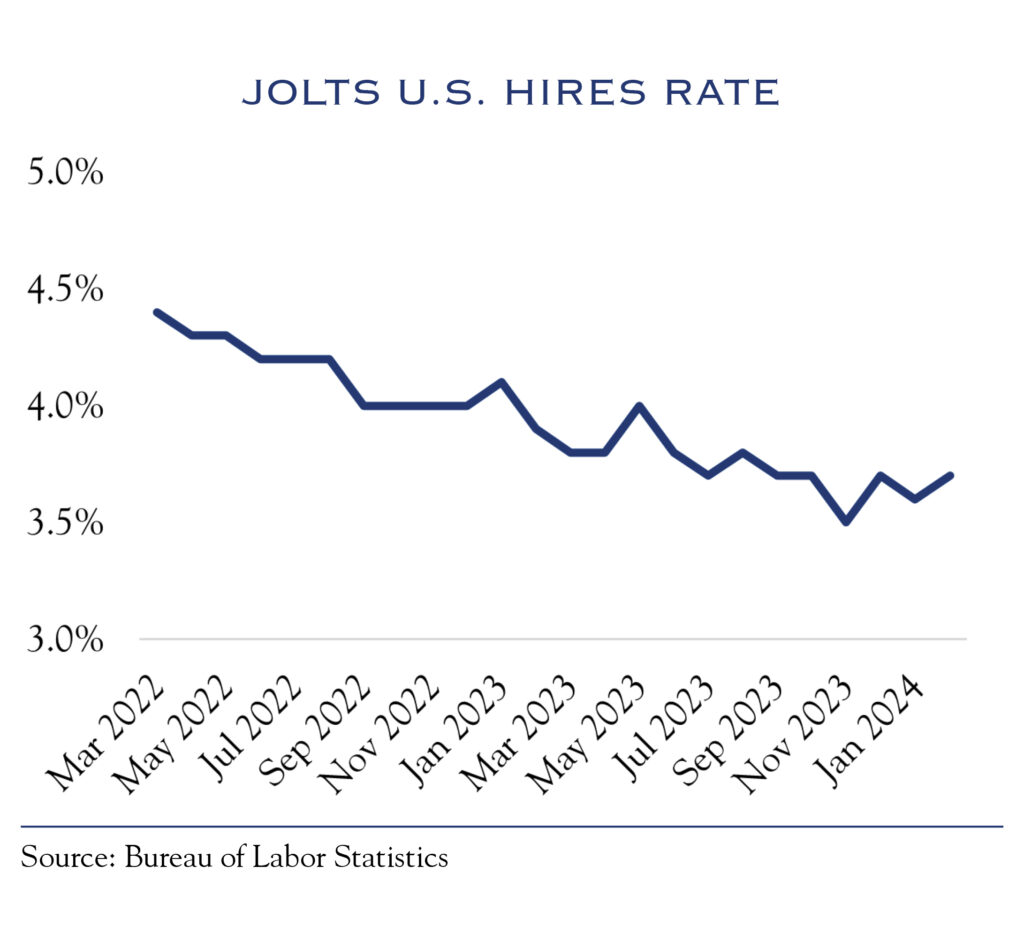
Nonetheless, there are further signs of a slowing employment situation. The BLS calculates a hiring rate that is simply a percentage of new additions to payrolls. While robust at +3.7%, it has consistently slowed over the past two years. In other words, employers are still hiring, but at a slower rate.
The BLS Quits Rate has also declined. Typically, “quits” are higher in a more robust hiring environment, as employees are more likely to seek new employment rather than stay put. At 1.8%, the Quits Rate is running around the long-term historical average, and while not concerning, it indicates some slowing momentum in the employment situation.
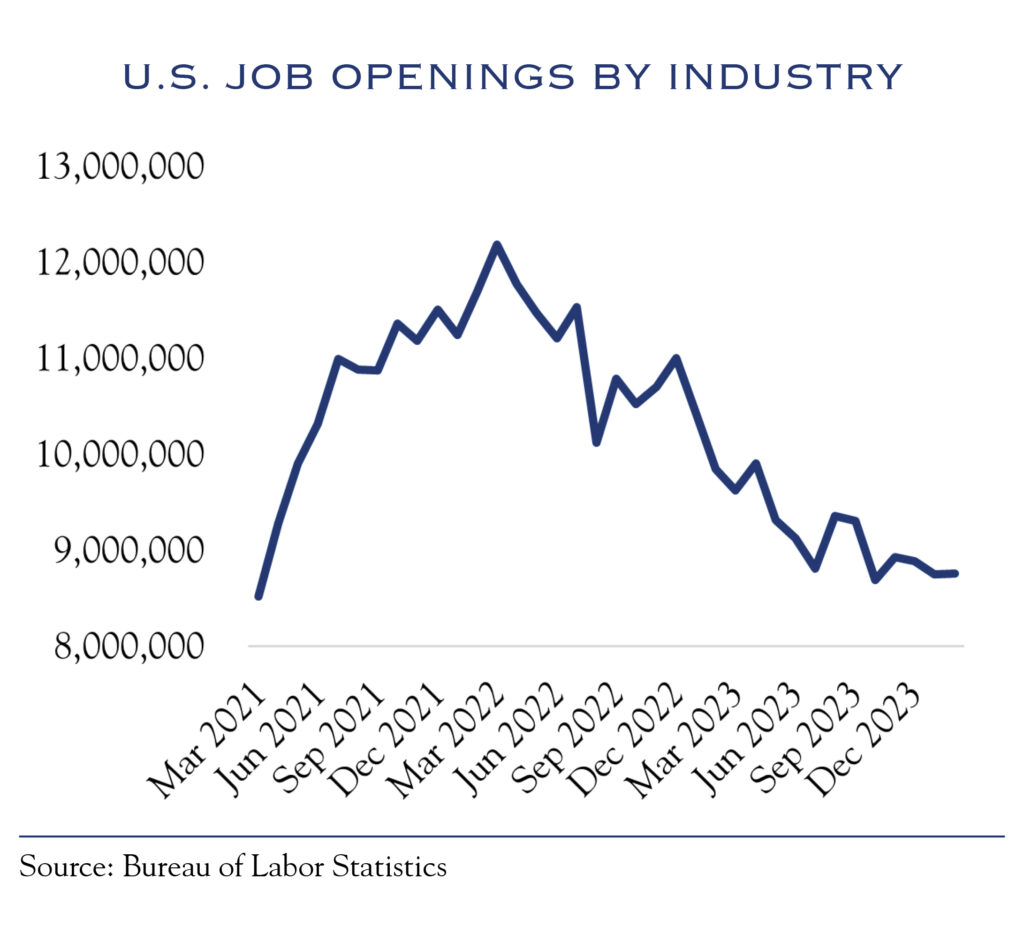
Another important metric is the number of job openings measured by BLS. This figure peaked at over 12 million in 2022 and has been slowly dropping to a current reading of 8.8 million. While still well above the pre-pandemic average of 4.5 million, the continued decline in job openings is another sign that future growth will likely be slower than current growth.
Consumer Spending
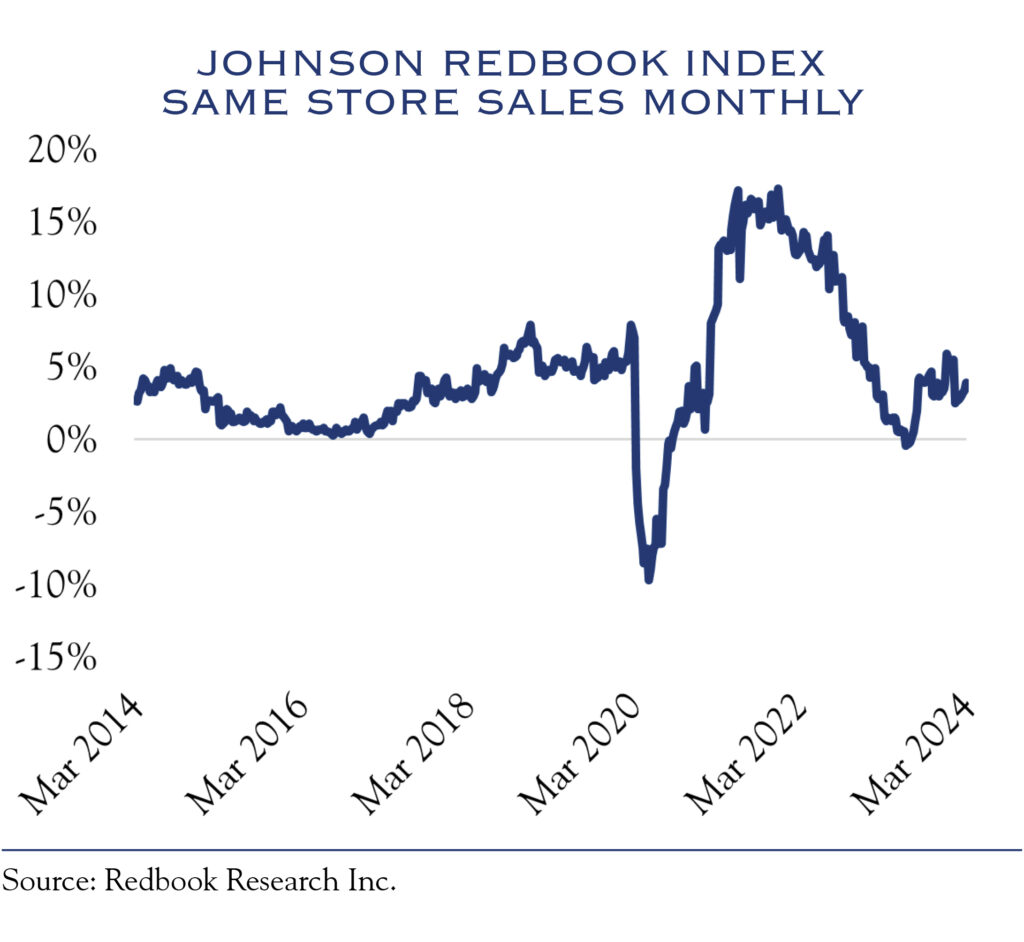
The Johnson Redbook Index measures same-store sales across a large swath of retailers dating back to the 1990s. It presently shows growth in sales of +3.9%, slightly higher than the long-term average since 1997. Credit card data show a spending pattern consistent with economic growth of +2.0 to +3.0%.
Anecdotal evidence from earnings calls suggests that portions of the consumer base are starting to moderate their consumption. For most, this has been a “return to normal” rather than a cause for concern.
- One great indicator of consumer health comes from observing trends at consumer-facing companies, such as a brand-name U.S. coffee store chain. While noting that loyal customers increased spending in the fourth quarter of 2023, occasional customers who visit in the afternoon came in less frequently. They also observed lower sales of higher-priced merchandise, surmising that “our consumers are now more cautious in their spending.” These observations are consistent with a slowdown in discretionary spending across some income segments and a return
to typical spending patterns. - Restaurants also provide an interesting window into the consumer, as spending on meals away from home is highly sensitive to financial conditions and perceptions of economic strength. One restaurant company noted, “The lower-income consumer does appear to be pulling back, and the mix of guests based on income is now in line with pre-COVID.” They expect same-store sales growth of 1.5% to 2.0%, consistent with our expectations for overall economic growth.
These observations of slower growth are part of a common theme across the economy: a return to pre-COVID conditions. As a reminder, that’s not bad, though it is not the above-average growth of recent years. The slower growth backdrop means companies must work harder to find productivity to boost margins and earnings.
As the use of new technology spreads, smaller companies will also begin to see benefits, though individual company analysis will become increasingly important. As with the economic disruptions in the pandemic, companies will have the opportunity to distinguish themselves by their ability to be dynamic, adaptive, and innovative.
Interest Rate Outlook—It’s the Journey, Not the Destination
The noise in yields on Treasuries and shifting interpretations of expected Fed policy creates an interesting conundrum for equity investors: Should investors be focused on the journey or the destination?
As expectations evolve for the Federal Reserve’s future interest rate policy, bonds have continued to bounce around, mostly within a range of 4.00% to 4.25% in recent weeks.
Futures markets for Fed Funds Rates predict the base-case scenario of three rate cuts in 2024. While this is fewer than the six projected a few months back, it continues to confirm that the next move is likely to be a cut. Presently, this same implied outlook projects a cut in June.
The ultimate destination for Fed Funds is the neutral rate, at which monetary policy is neither contractionary nor expansionary. This rate, also referred to as r*, won’t be determined for some time. However, Fed policy might not settle into a sustained neutral rate until the economy experiences a “normal” recession and recovery. So, despite significant concerns over debt levels and long-run inflation, debates over the importance of the ultimate neutral policy for equity valuations are misplaced for now.
The Fed remains on a data-driven policy journey. The data shows a gradual slowdown in both inflation and economic growth, so it makes sense that rates would similarly decline gradually.
Commentary from the Fed indicates a long and gradual journey taking rates lower. As outlined on March 20 in the “dot plots,” the Fed Funds Rate will gradually decline through the end of 2026. While that path will undoubtedly evolve, a backdrop with a likelihood of multiple years of gradually declining rates is favorable for equity valuations.
Equity valuations remain elevated at 25x trailing earnings and 21x forward earnings. However, so long as investors embrace the likely long journey to lower rates, elevated valuations can be sustained. Equity investors seem to be saying, “Give us lower rates over the next two years, and we will be OK with higher valuations.”
Earnings to the Rescue?
With valuations and sentiment somewhat elevated and Fed policy on an uncertain and gradual path lower, the main reason for equity optimism is based on hope for higher earnings. Earnings estimates for 2024 have barely moved over the past 12 months. In March 2023, consensus estimates were for $242 in earnings for the S&P 500. Currently, those estimates sit at $243.
Our research shows that economic growth of 1.5% to 2.5% is consistent with earnings growth of 7%, which is below consensus expectations for 9% growth. However, 9% may be undershooting the mark.
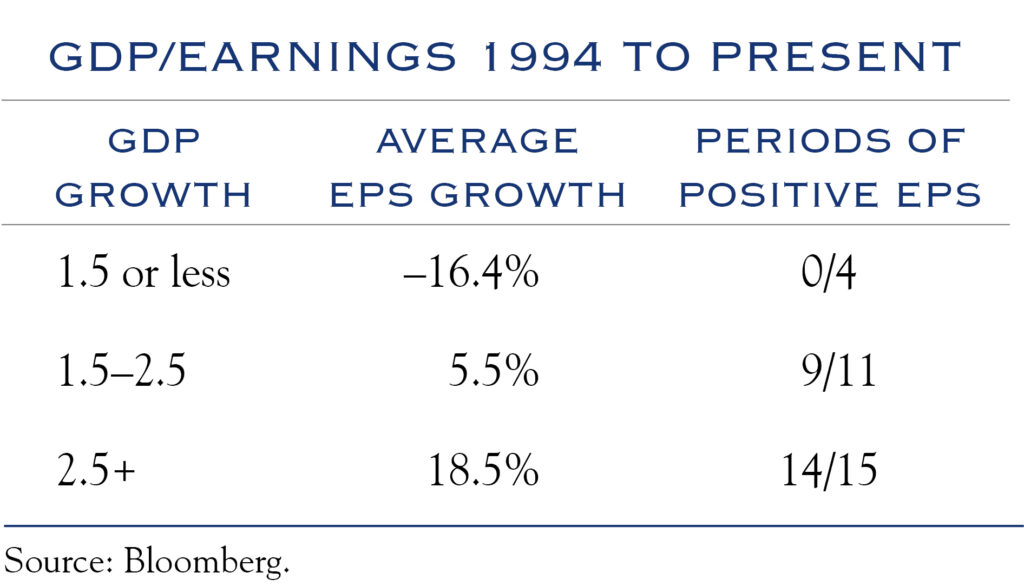
One reason is that the economy may well outperform expectations embedded in those forecasts. March 2023 was somewhat tumultuous, with stress in the regional banking sector and high expectations for recession. Typically, estimates start high and trend lower, owing to a generally optimistic bias. This year could prove atypical, as the macroeconomic backdrop has been far more resilient than most imagined.
Another more consequential component is the potential for companies to boost productivity. Earnings transcripts of consumer-facing companies point to “return to normal” growth trends and highlight some significant productivity issues. For example, labor costs are important for retail and hospitality companies. With wages growing at 4.3% in the U.S. economy at large, using technology to manage labor costs is critical for profits. The same restaurant company referenced above also mentioned that their use of AI has helped predict demand, manage scheduling, and lower training costs.
It is early days for the use of robotics and AI to manage costs, boost productivity, and lift profit margins and earnings. We expect individual companies to distinguish themselves from peers by how well they adapt to a slower growth environment and by how well they embrace the opportunity to boost productivity. That backdrop bodes well for stock selection and overall equity earnings.
Outlook
The Fed & Rates
Fed policy remains an important driver of market sentiment. We observe two camps forming within the Fed. One stresses the need to avoid setting an overly restrictive policy as inflation and the economy are moderating. That view would imply a need to reduce rates gradually while remaining restrictive. The other camp is focused on avoiding any reduction in rates for now, as economic growth remains stable and inflation remains above 2.0%. We expect the Fed to outline its data-driven path to cuts more clearly before making those cuts. For now, we look for rates to remain range-bound.
Credit Spreads
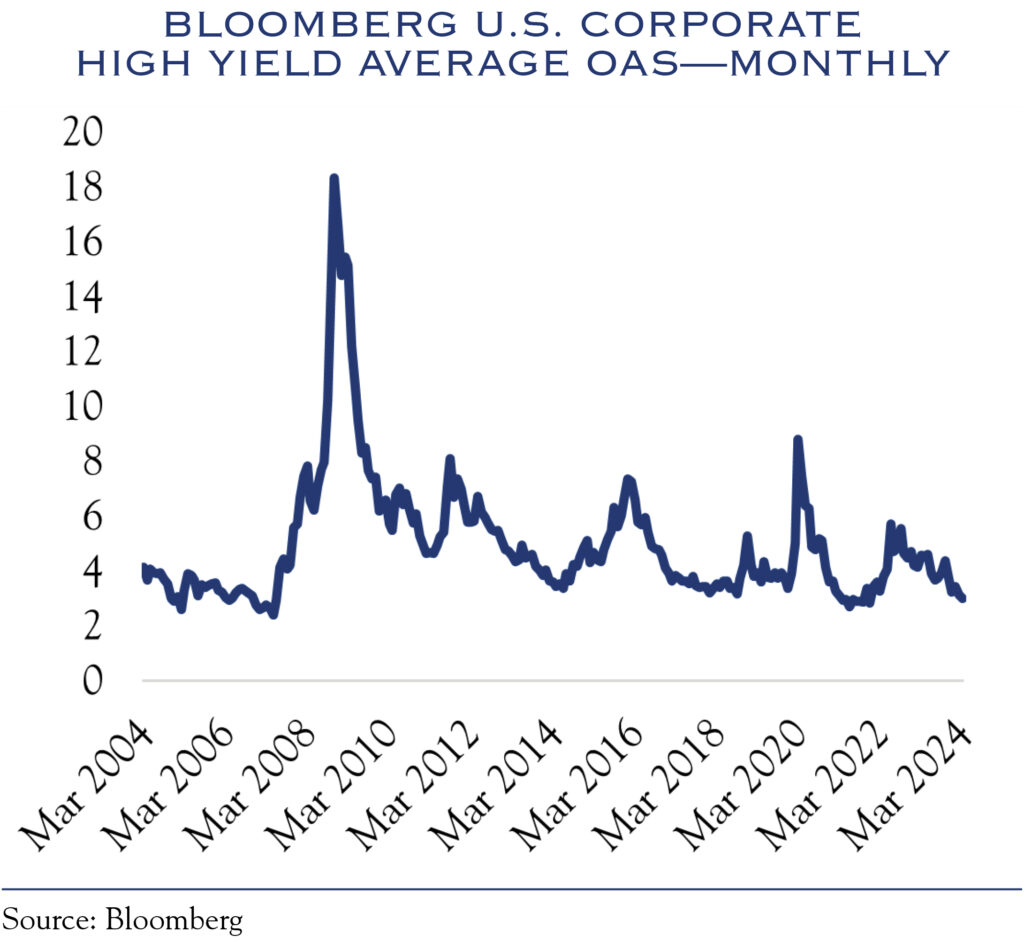
The desire to lock in yields at current levels has produced a strong backdrop for corporate credit risk. Spreads have been quite tight, with investors pricing higher and moderate credit risks at similar levels. With the overall market for credit risk rather expensive, our guidance remains to be cautious with credit risk in general, focusing instead on
individual security credit analysis.
Equities
Given the headwinds created by higher-than-average valuation levels, we expect only modest gains in equities. Despite the somewhat lofty valuation metrics, many of the largest companies are fast-growing and often have stellar balance sheets. For the most part, many mega caps have grown on the back of their earnings power, making this a much different set of big companies than those in the 1990s internet-driven bubble. For stocks, earnings gains will provide the fuel to move higher. As the productivity-boosting benefits of technology spread through a wider swath of the economy, we look for earnings gains to broaden. The broadening of gains, in turn, will lead to returns converging between larger and smaller companies, with advances slowing a bit for large companies and accelerating somewhat for smaller companies. An essential part of this process, however, is interest rates. Until rates begin to move lower more decisively, the advances in smaller-cap companies are likely to be sporadic rather than sustained.
This communication contains the personal opinions, as of the date set forth herein, about the securities, investments and/or economic subjects discussed by Mr. Teeter. No part of Mr. Teeter’s compensation was, is or will be related to any specific views contained in these materials. This communication is intended for information purposes only and does not recommend or solicit the purchase or sale of specific securities or investment services. Readers should not infer or assume that any securities, sectors or markets described were or will be profitable or are appropriate to meet the objectives, situation or needs of a particular individual or family, as the implementation of any financial strategy should only be made after consultation with your attorney, tax advisor and investment advisor. All material presented is compiled from sources believed to be reliable, but accuracy or completeness cannot be guaranteed.
© Silvercrest Asset Management Group LLC


