“It was one of those March days when the sun shines hot and the wind blows cold: when it is summer in the light, and winter in the shade.”
—Charles Dickens, Great Expectations
The weather in the Northeast and the mood of markets are in a springtime arrangement; hot, cold, and everything in between are reminders that patience and nuance are required: patience to withstand the wildly swinging temperatures and moods that exist within a single day and nuance to know that there is no easy answer to the question of what the weather or the market is like today.
Below are charts and observations on a series of important metrics to sort through the complexity. Overall, we expect the market choppiness to continue, driven by a collision between high valuations and ever-changing sentiment. Looking through that short-term volatility, an enormous opportunity is created by the earnings power from a slowly expanding economy and the potential to boost productivity.
High Valuations Create High Expectations
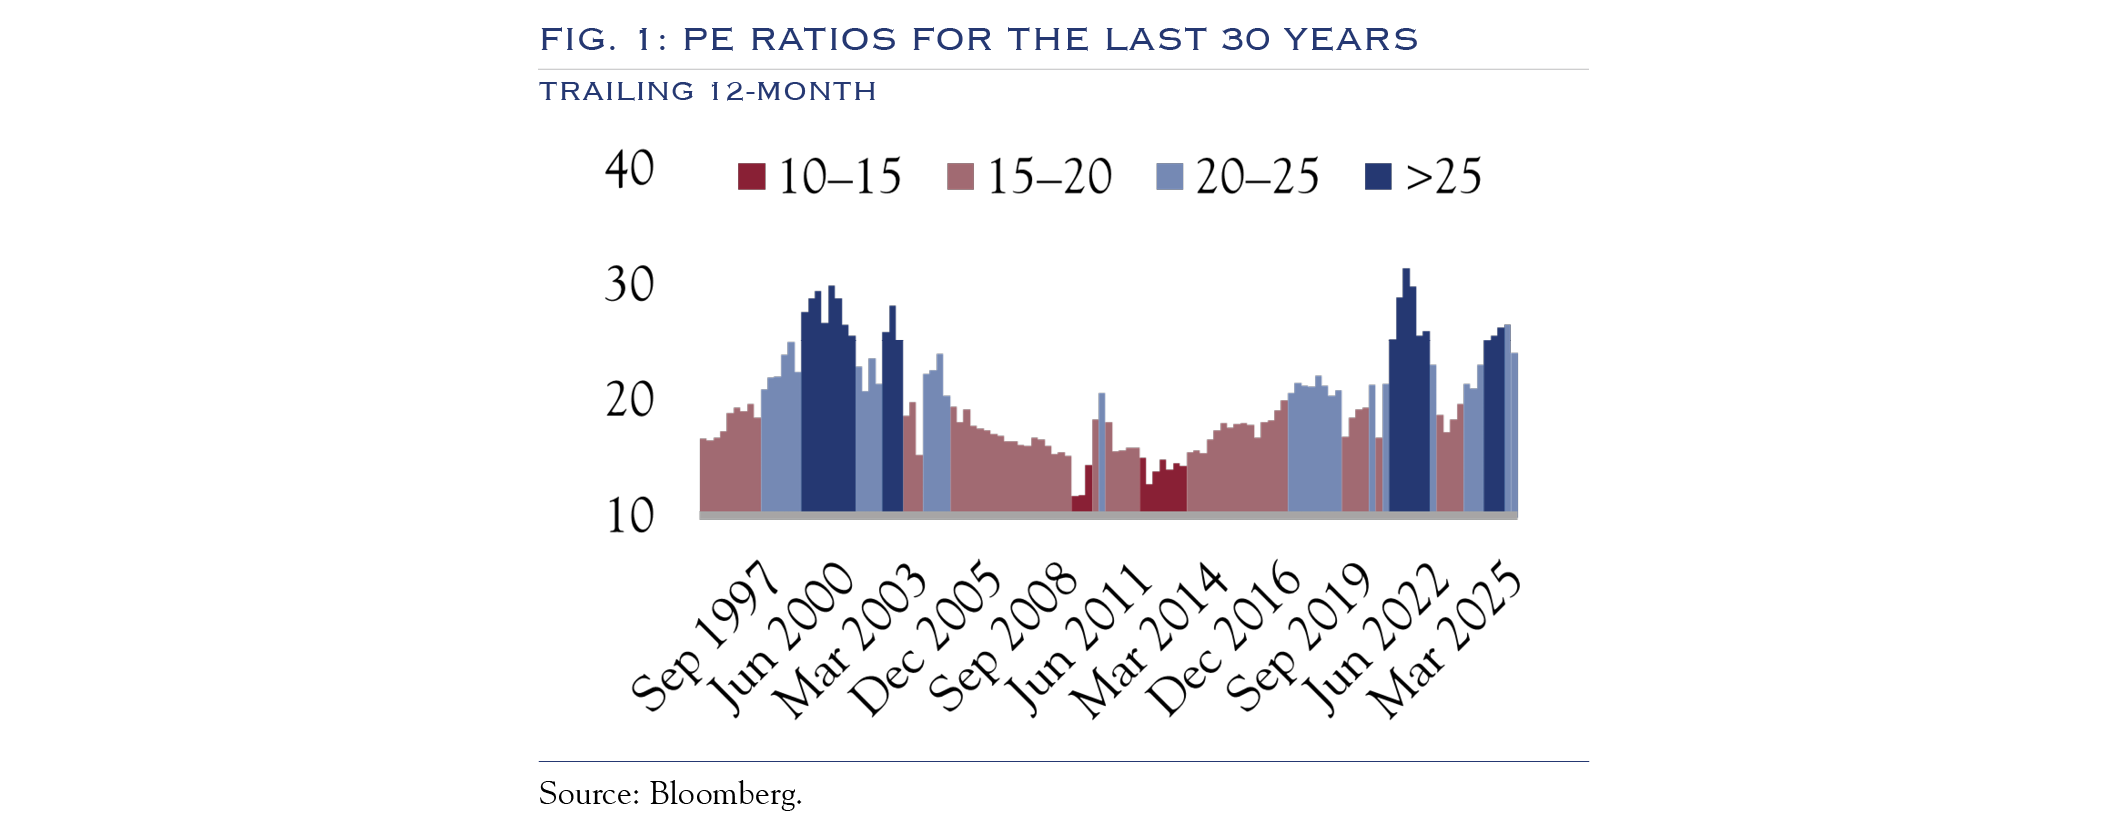
Entering 2025, expectations were running high for the economy and markets. This was reflected in elevated valuations, with the Price/Earnings (PE) ratio of the S&P 500 hitting a level of 27.6 in February, well above the long-term average of 19.8. In February, valuation, as measured by PE, was in the 17th percentile of the past 30 years (Figure 1).
One byproduct of these elevated valuations is that realized events must live up to the expectations embedded in those lofty levels. As shown in the charts and commentary below, events and data surrounding the economy haven’t been bad, but they have been complex and are a downshift compared to recent history. As a result, year-to-date returns suffered, with the S&P 500 posting a –4.58% loss.
Political Backdrop Creates Volatility
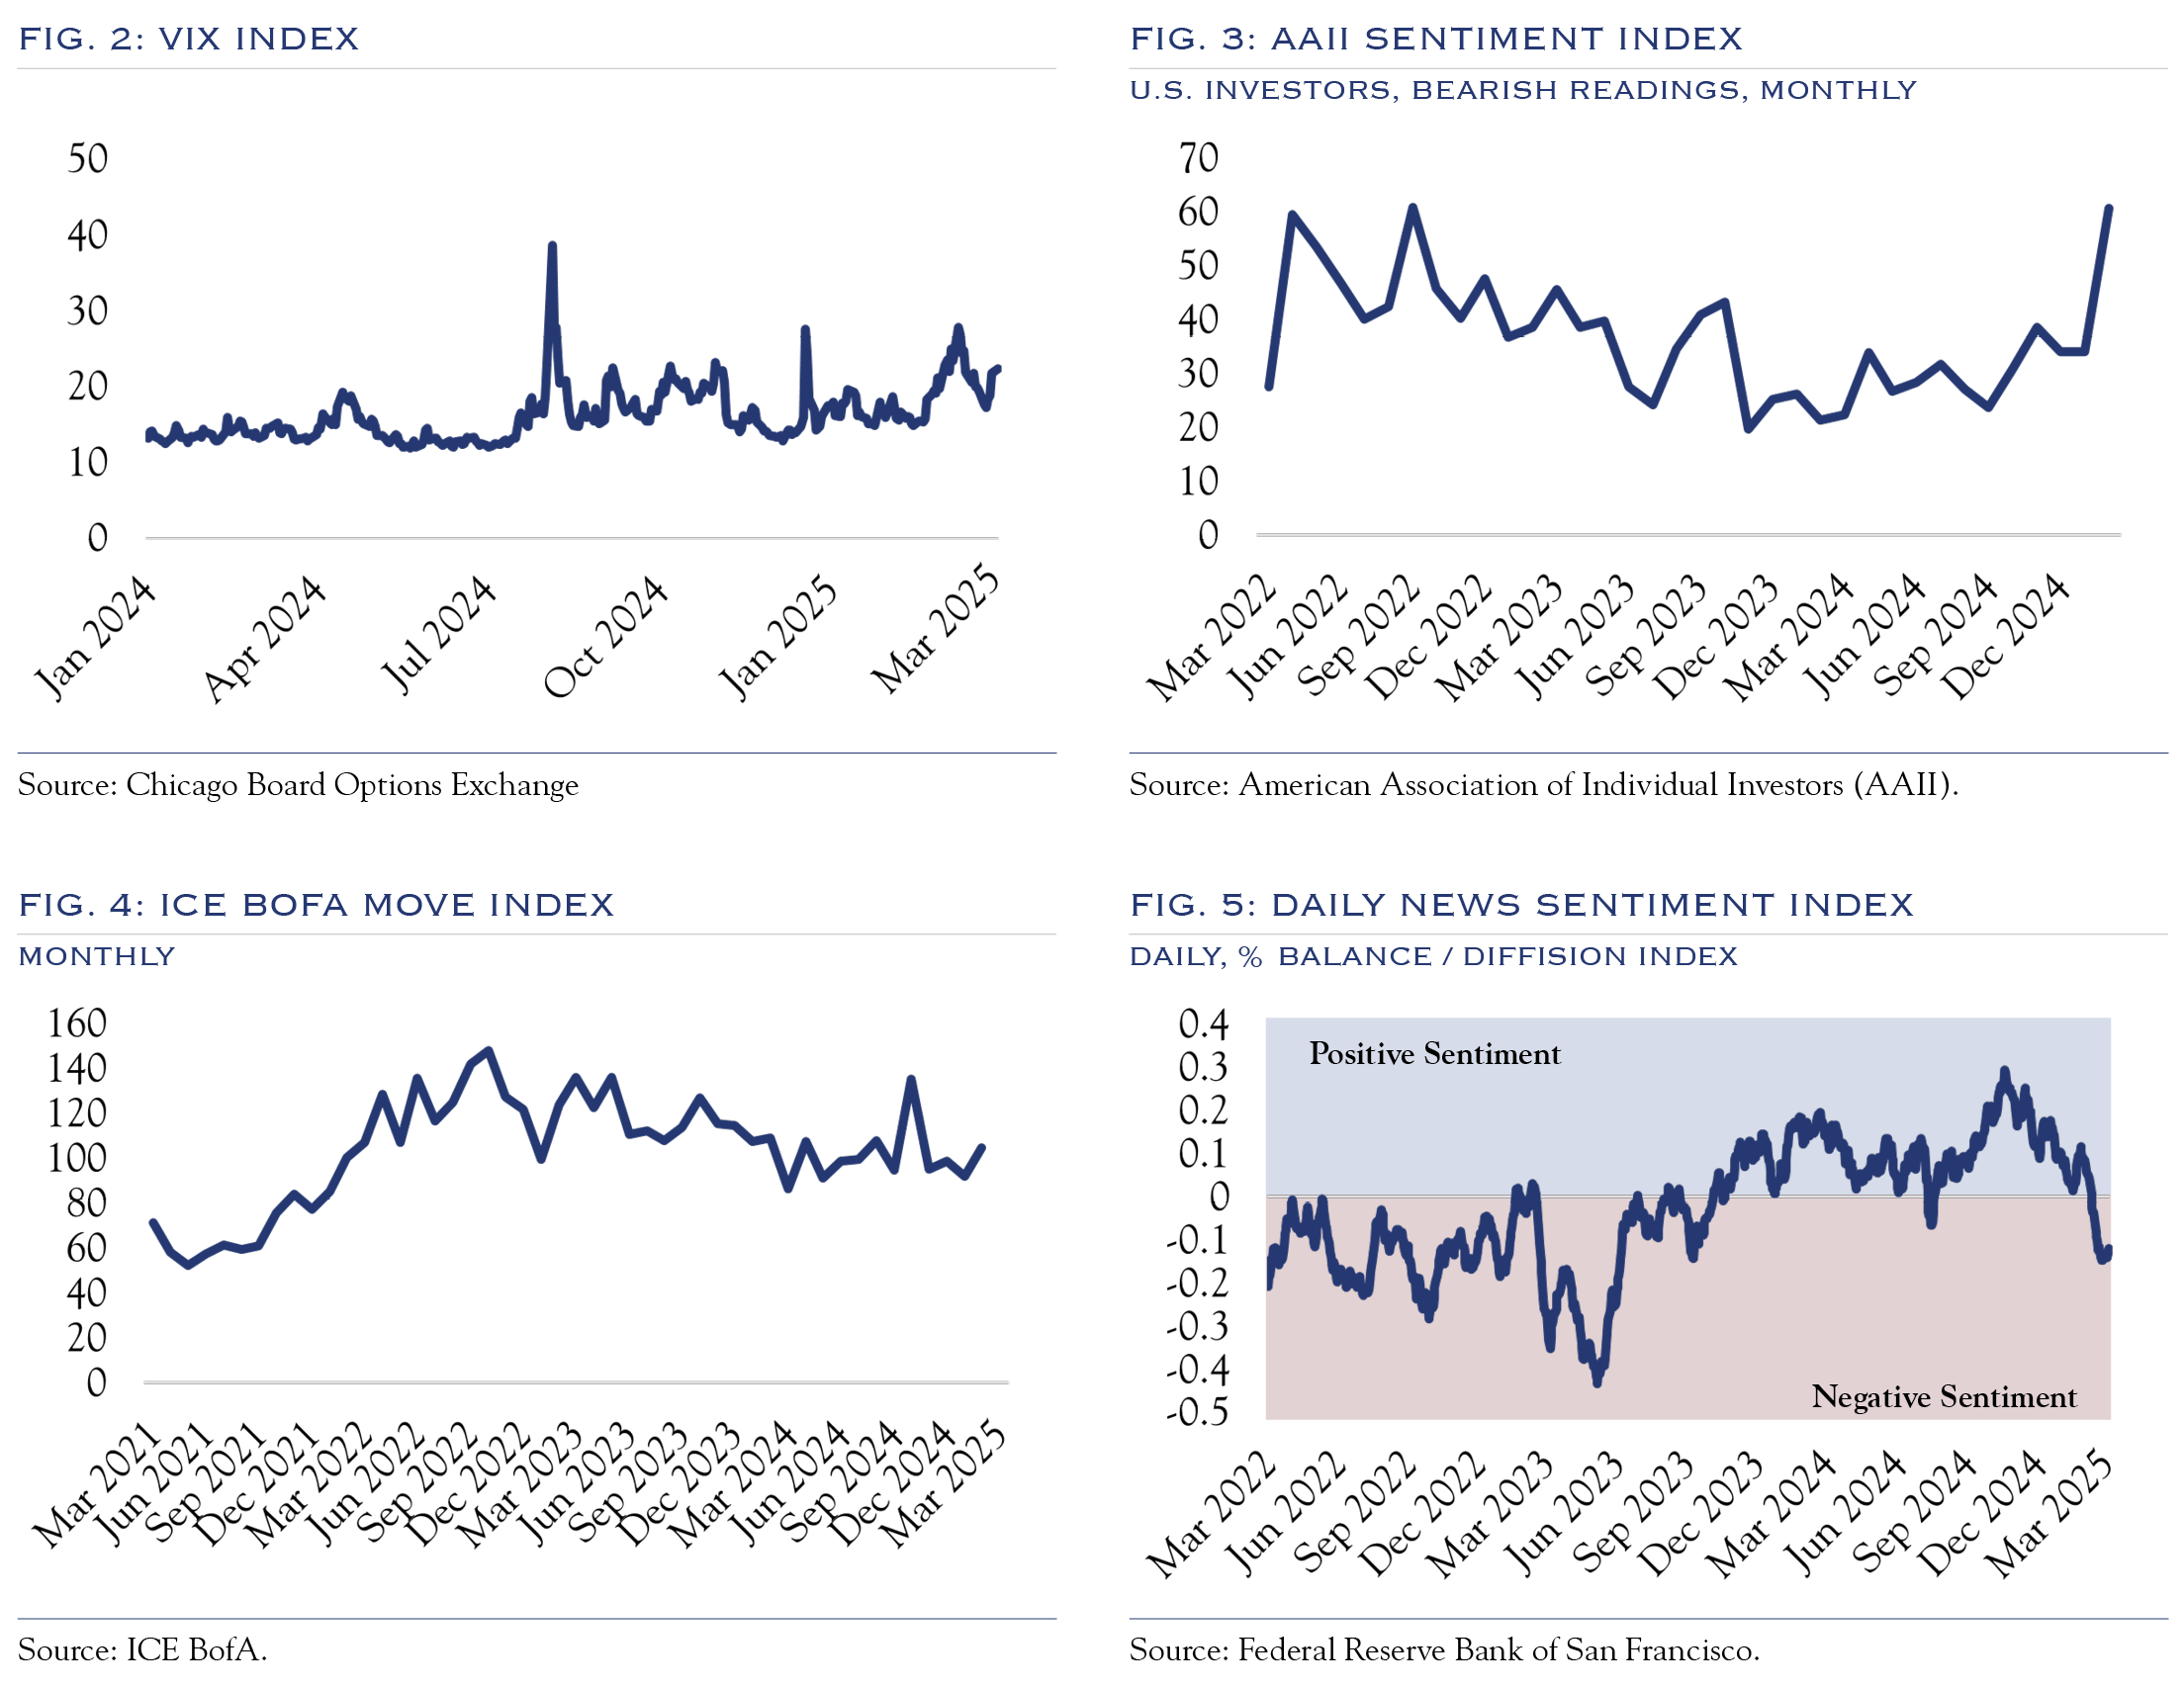
In a polarized and fast-moving political environment, it is unsurprising that market volatility has been running hot. The VIX Index is one way to assess equity market volatility. At the start of the year, the VIX posted readings around long-term averages. As shown in Figure 2, this measure of volatility picked up substantially throughout February and into March. This occurred in conjunction with an increase in the “bear” readings for the AAII Sentiment Index (Figure 3). Likewise, the ICE BofA MOVE Index of bond market volatility remained elevated in February and early March (Figure 4). Similarly, the San Francisco Fed Daily News Economic Sentiment Index began to decline, indicating a decidedly more negative tone of economic news (Figure 5).
The First Year of a Presidency is Often Messy
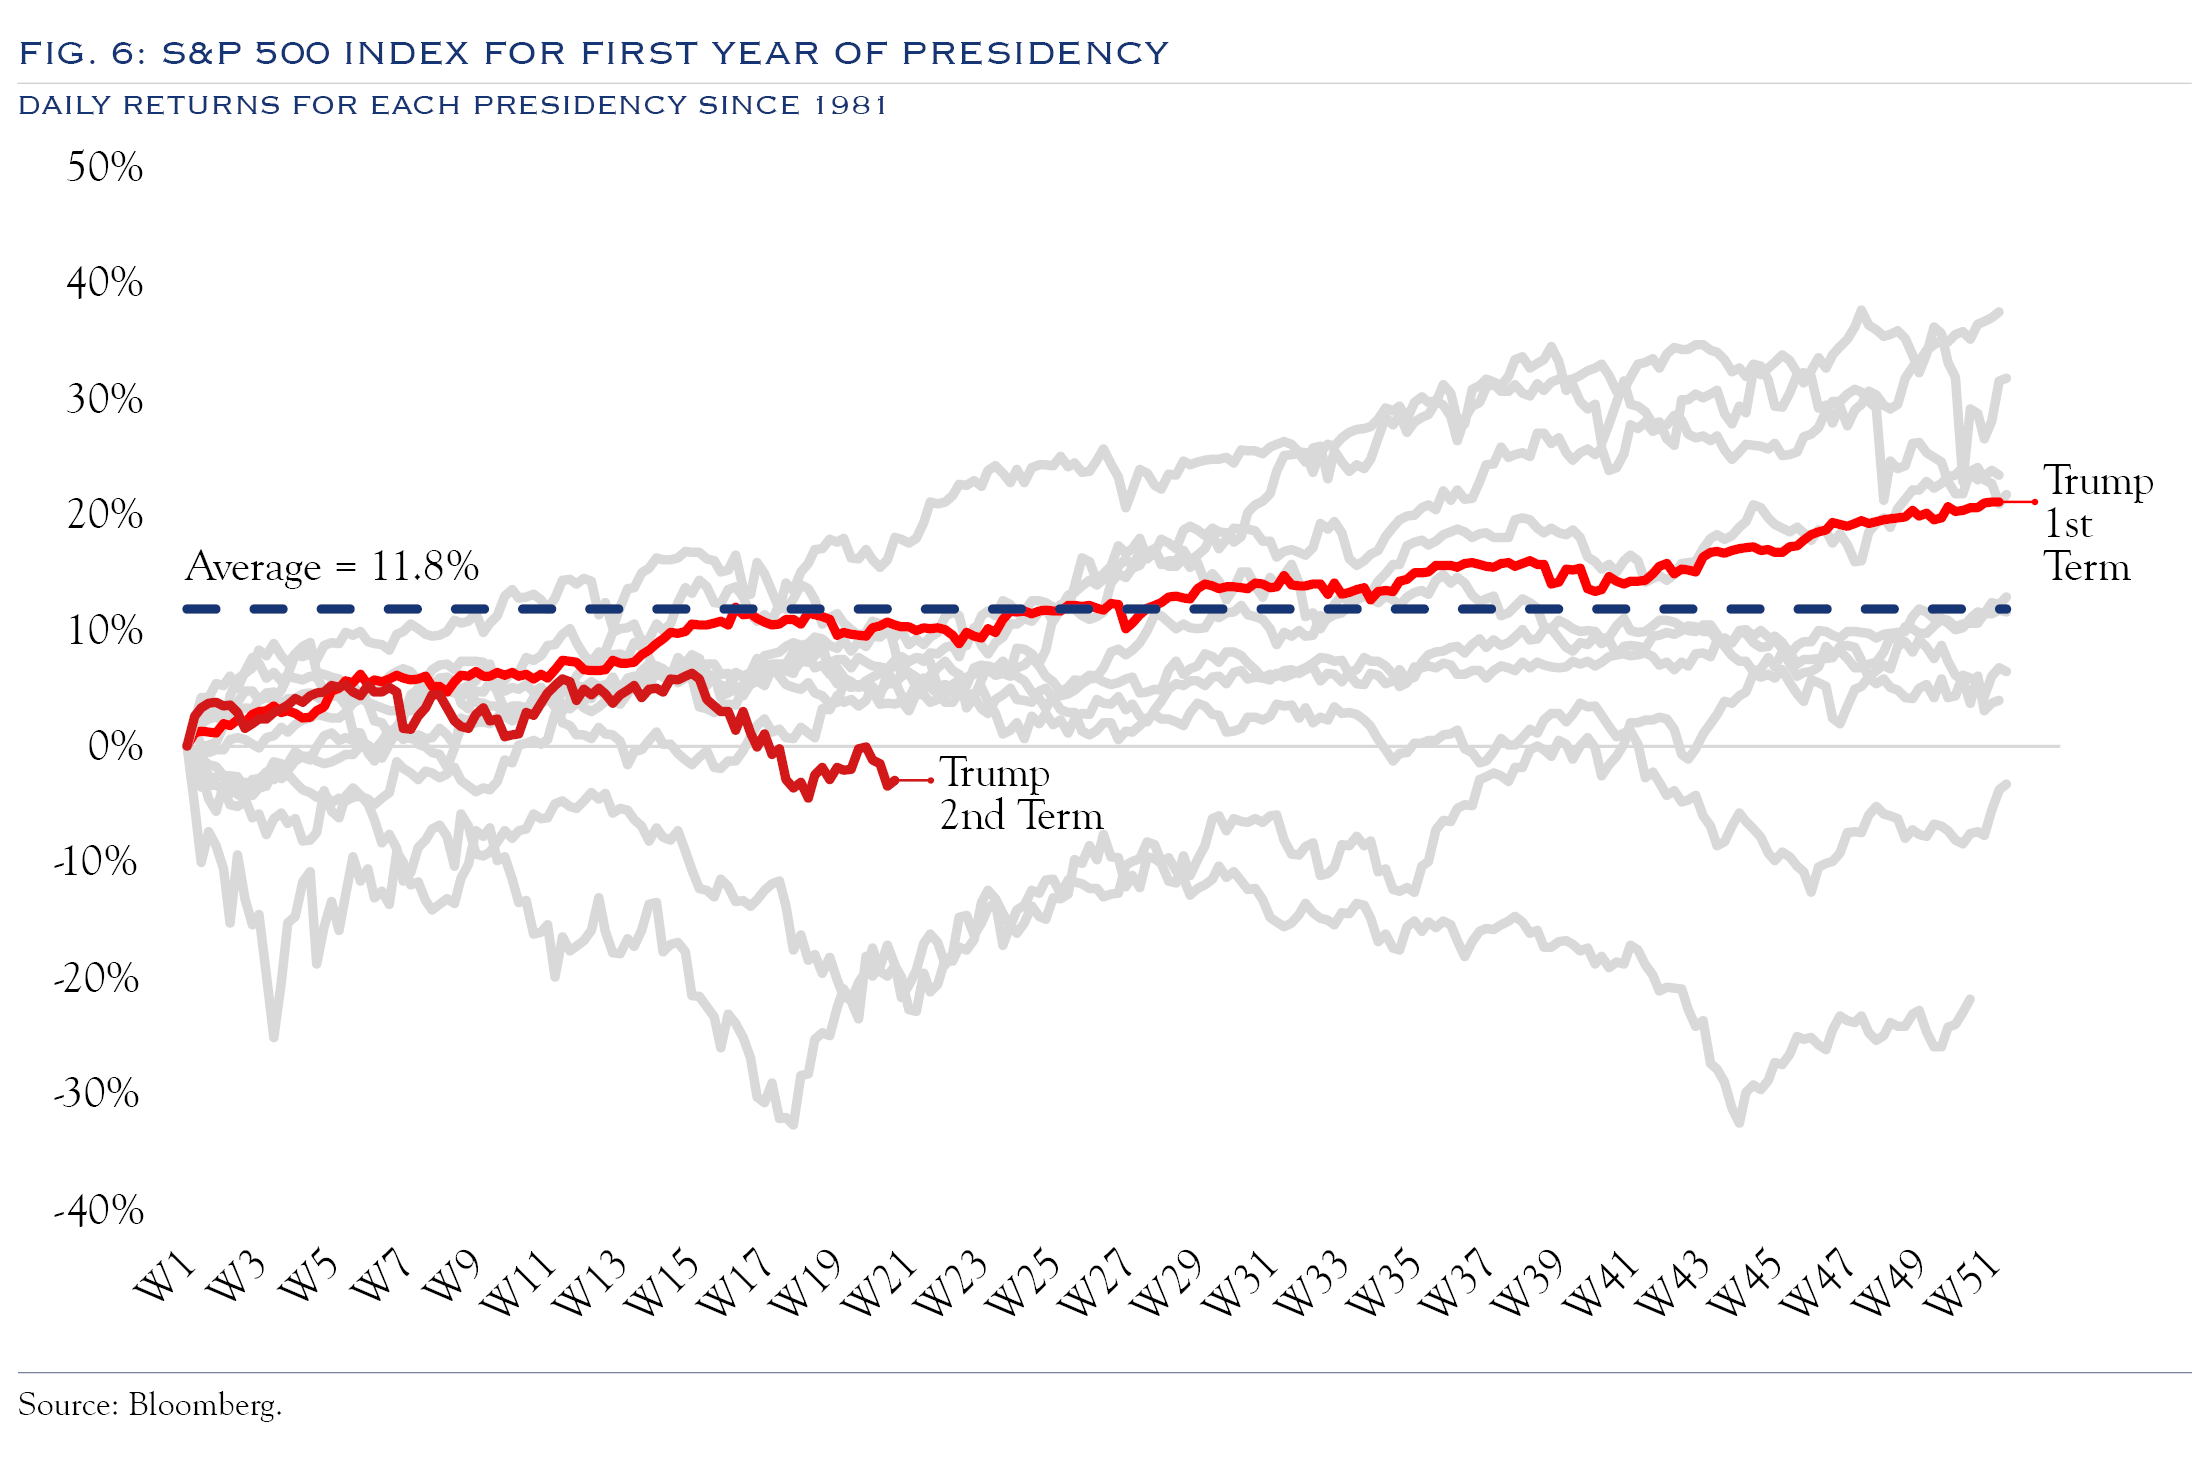
The first year of a presidency is typically strong, with returns of +11.8% on average over the past 12 elections, though the first months are often rocky as campaign rhetoric collides with the messy process of policy change. In 2025, changes enacted by the second Trump administration have been rapid in some areas, with Executive Orders being used extensively. However, challenges such as the debt ceiling and extension of tax cuts are unfolding in a more typical, back-and-forth manner. As Figure 6 shows, this presidential year has had a weaker-than-average start for equity returns.
The relative weakness in equities can be attributed to a dip in valuations, which entered the year at high levels and have cooled a bit in response to the rapid pace of change and elevated levels of uncertainty over the future path of policy, combined with persistent inflation. In recent weeks, valuations have stabilized, perhaps coincident with administration officials making a more pronounced effort to communicate the benefits of a policy change requiring short-term pain for long-term gain. Ultimately, we expect year one of the administration to be more volatile than average but with typical returns, driven mainly by the fundamental drivers of the economy and earnings.
Mixed Signals on the Economy
Economic growth is the most significant question mark for investing in 2025.
Economic growth is the most significant question mark for investing in 2025. Policy noise is creating some uncertainty over short-term economic growth. In the longer term, most policies are geared towards increasing growth.
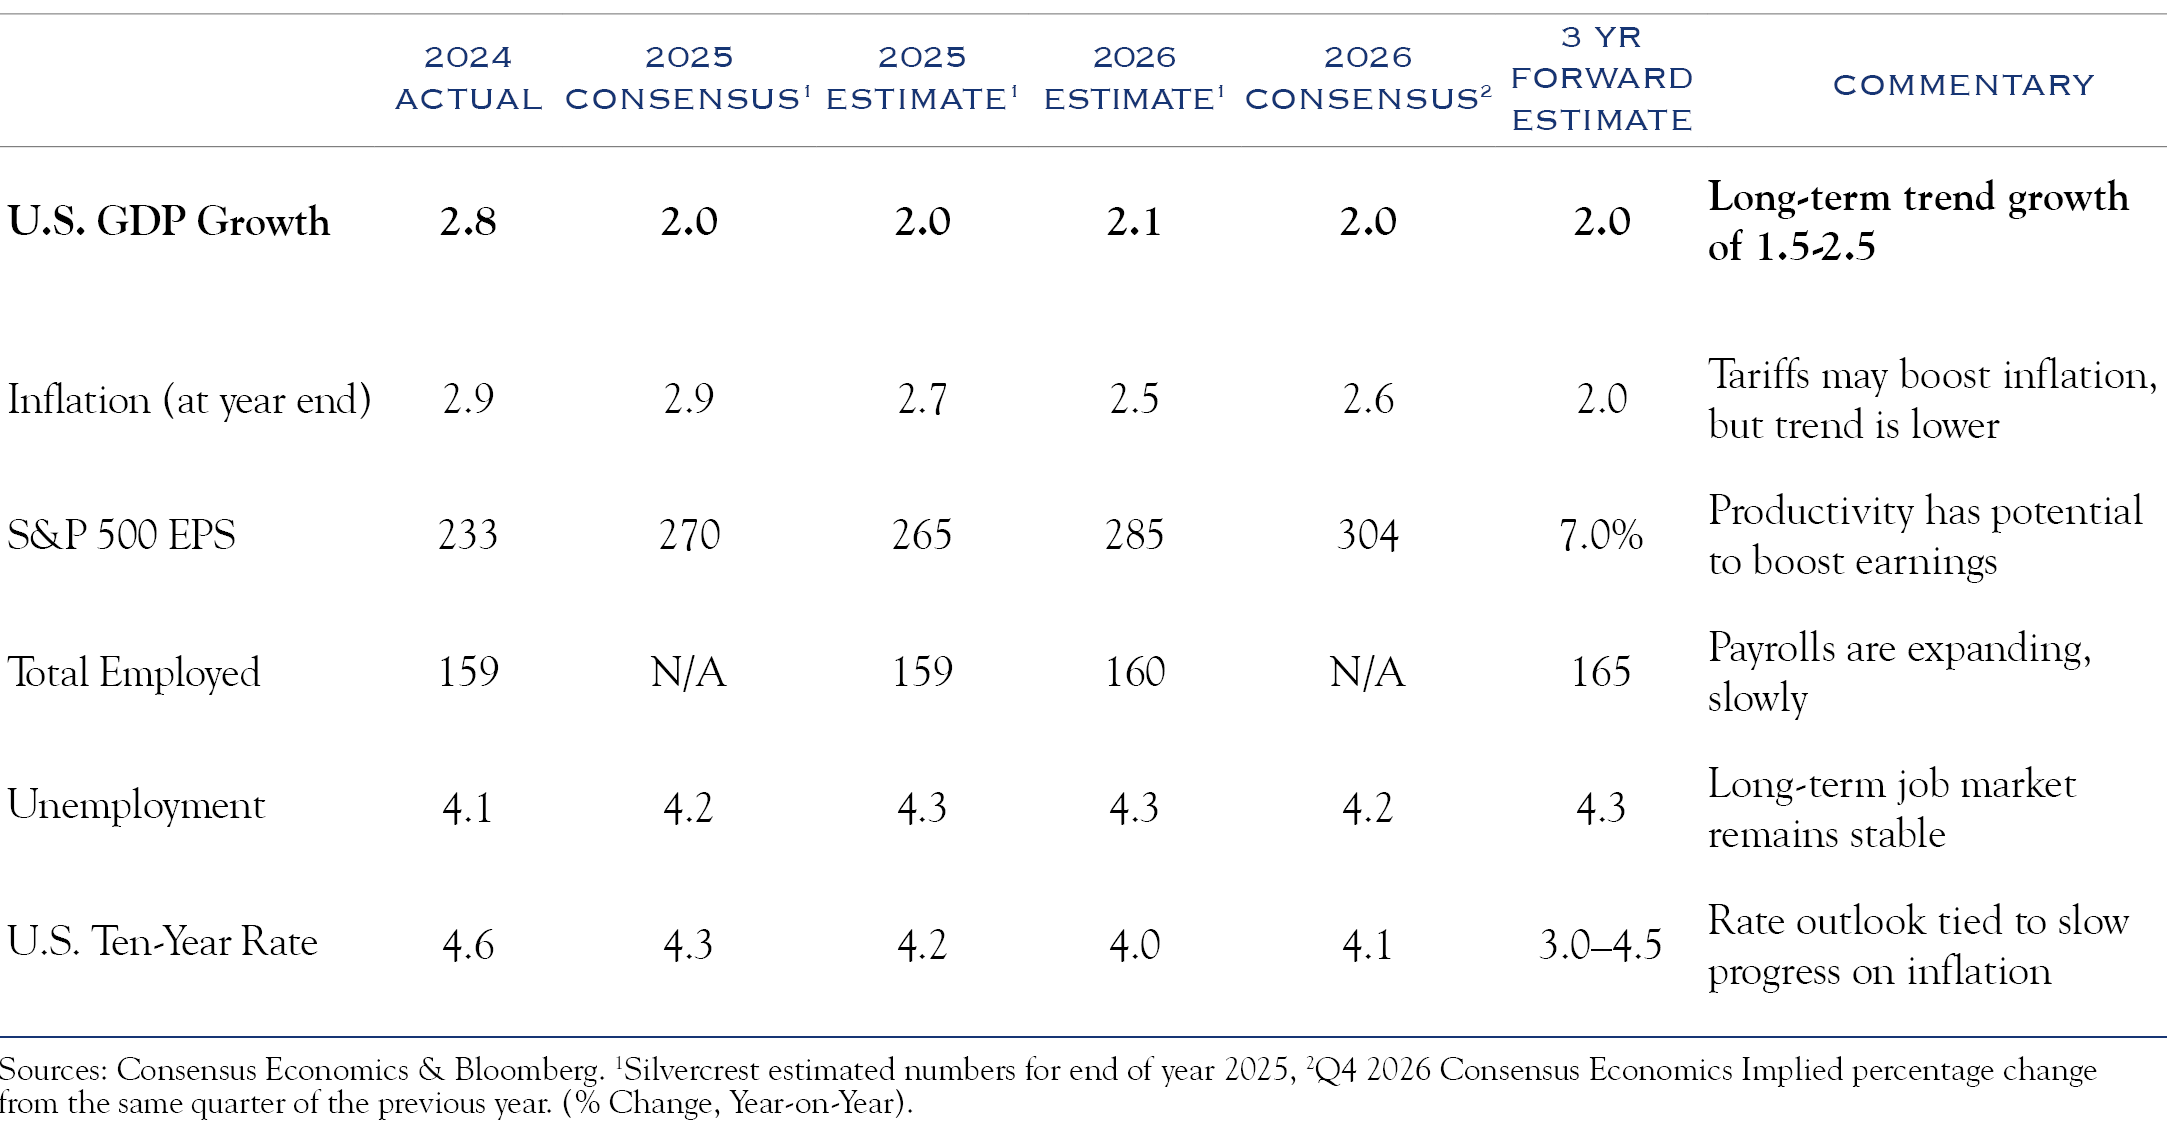
The current consensus expectation for 2.0% real GDP in 2025 is above the Fed’s recently lowered forecast of 1.7%. At 1.7%, growth will be approaching what we estimate to be a stall speed for earnings growth. Our research shows that GDP below 1.5% creates problems for equity earnings.
These lower growth estimates have put equities in a volatile holding pattern with two possible paths forward.
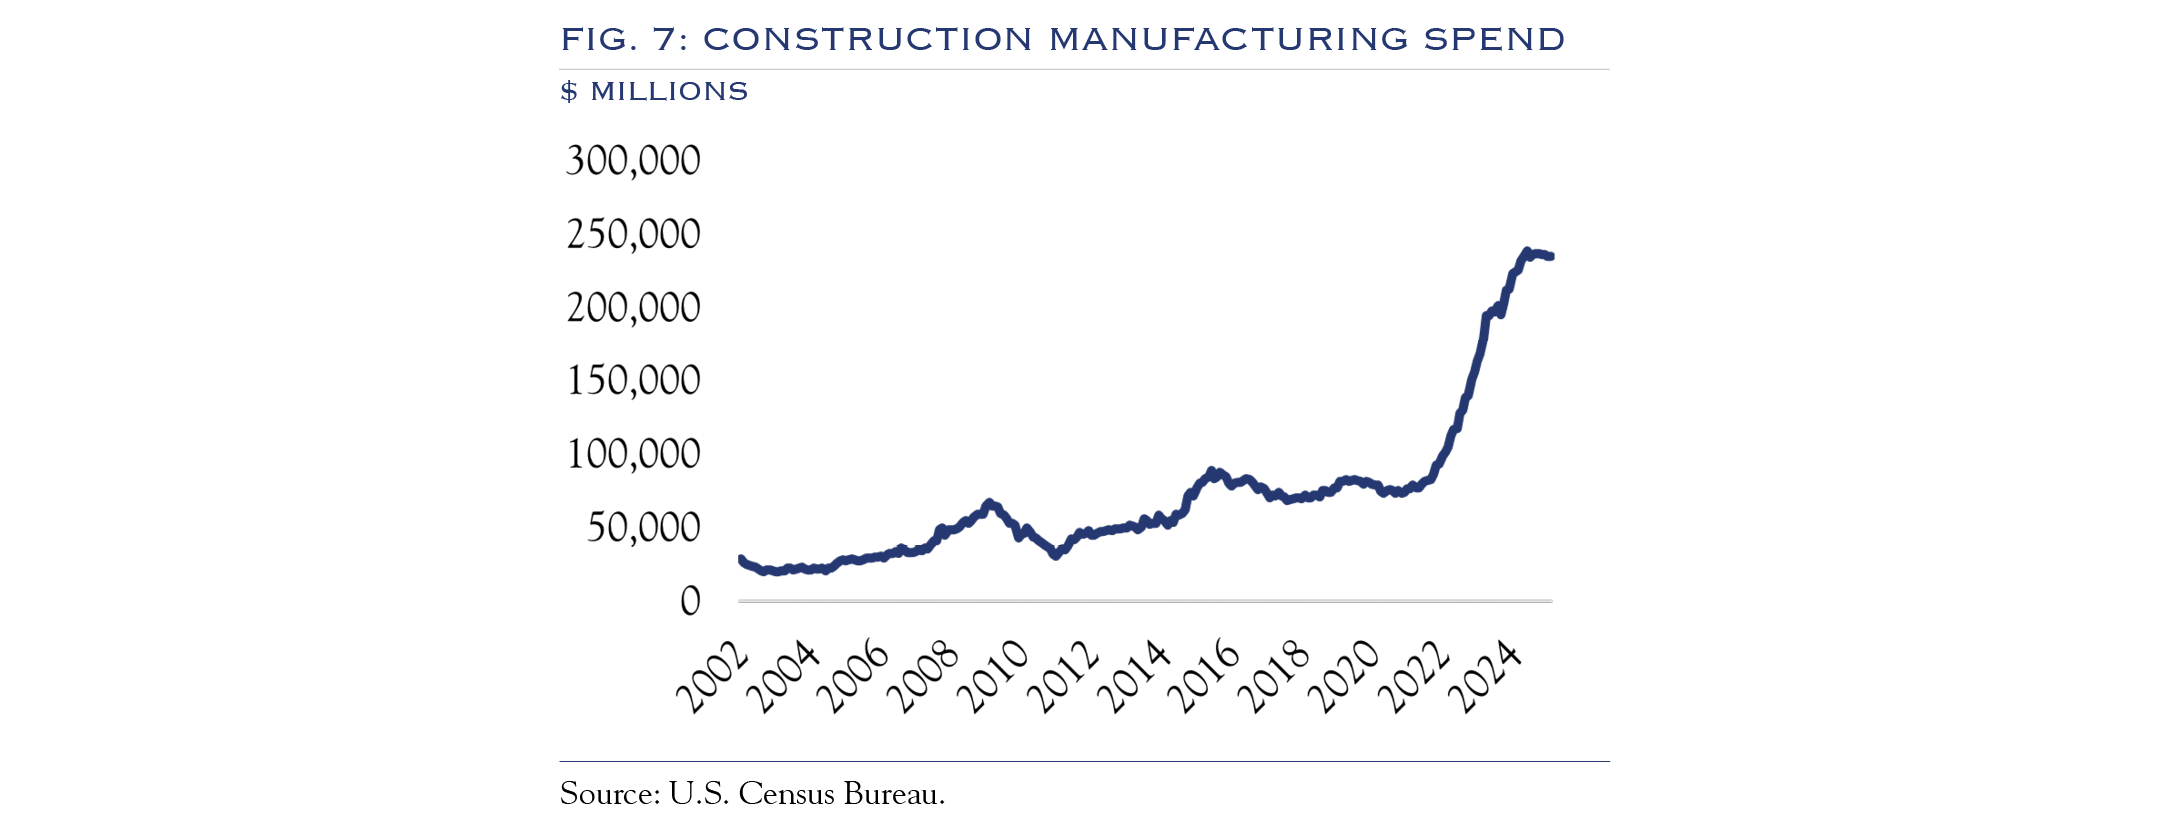
The first path is resolving policy uncertainty, which would likely get expectations back on track to renew the trend of capital expenditures (such as the manufacturing construction spending shown in Figure 7), hiring, and M&A, all of which support further economic growth.
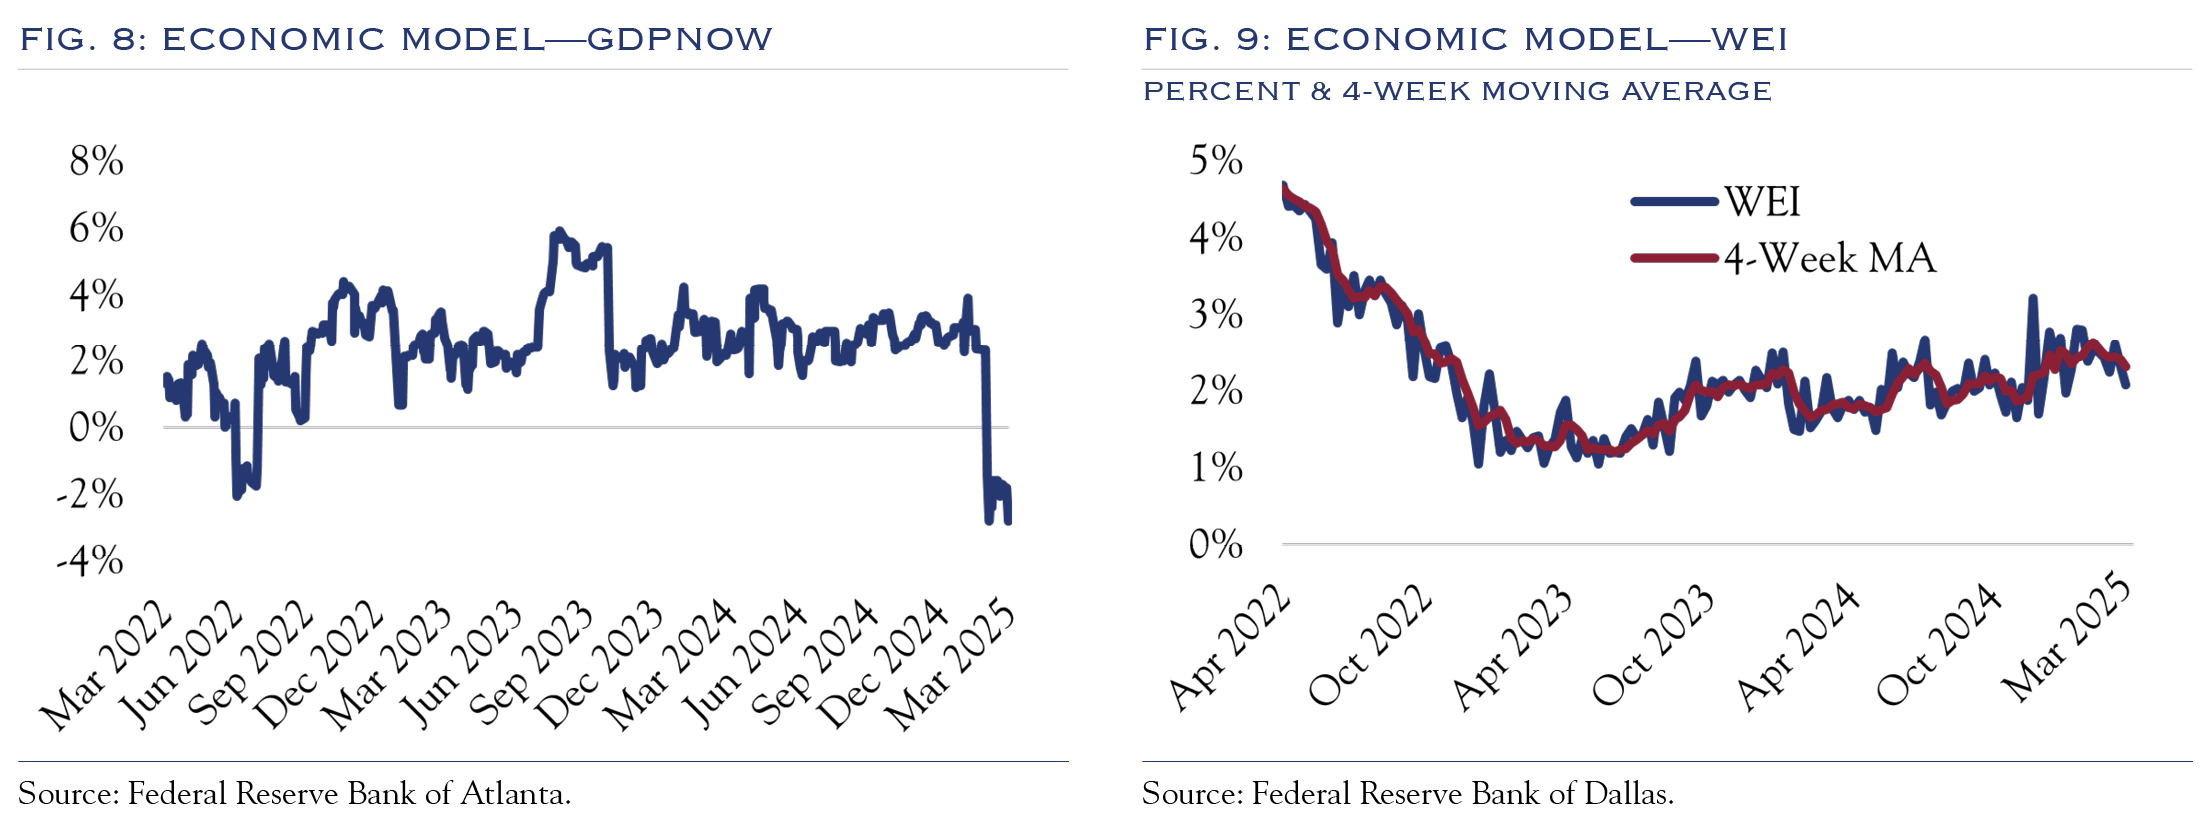
The second path requires following the data through a complex maze of conflicting models. In recent weeks, two prominent economic models have diverged significantly, with GDPNow pointing to economic contraction of –2.84% (Figure 8) and the WEI pointing to growth of +2.07% (Figure 9). There are two primary reasons for the difference—one is structural, and the other is specific to recent data. At a structural level, GDPNow forecasts GDP based on historical relationships between metrics and their predictive value for GDP. The WEI was developed as a “real-time” model, using weekly data to estimate the current run rate of GDP. Both approaches are useful. The recent negative reading in GDPNow was heavily influenced by a significant uptick in imports (which detracted from U.S. domestic growth). That import surge was partially driven by a desire to import in advance of tariffs. Mechanically, this reduced the rate of U.S. GDP, but it doesn’t say much about the current “run rate” for U.S. economic activity. In fact, GDPNow published some revised models, stripping out this distortion, which shows a slight expansion in economic activity.
The Federal Reserve Open Market Committee (FOMC) publishes an outlook for GDP and recently produced a forecast for growth of +1.7%, a downgrade from the prior reading of +2.1%. This was likely due partly to declines in “soft” metrics like sentiment or outlook from various sources and an ongoing downward trend in economic metrics.
Our base model for U.S. economic activity derives heavily from the potential spending power of the consumer. We look closely at several metrics which currently point to potential growth of 2.0% or more.
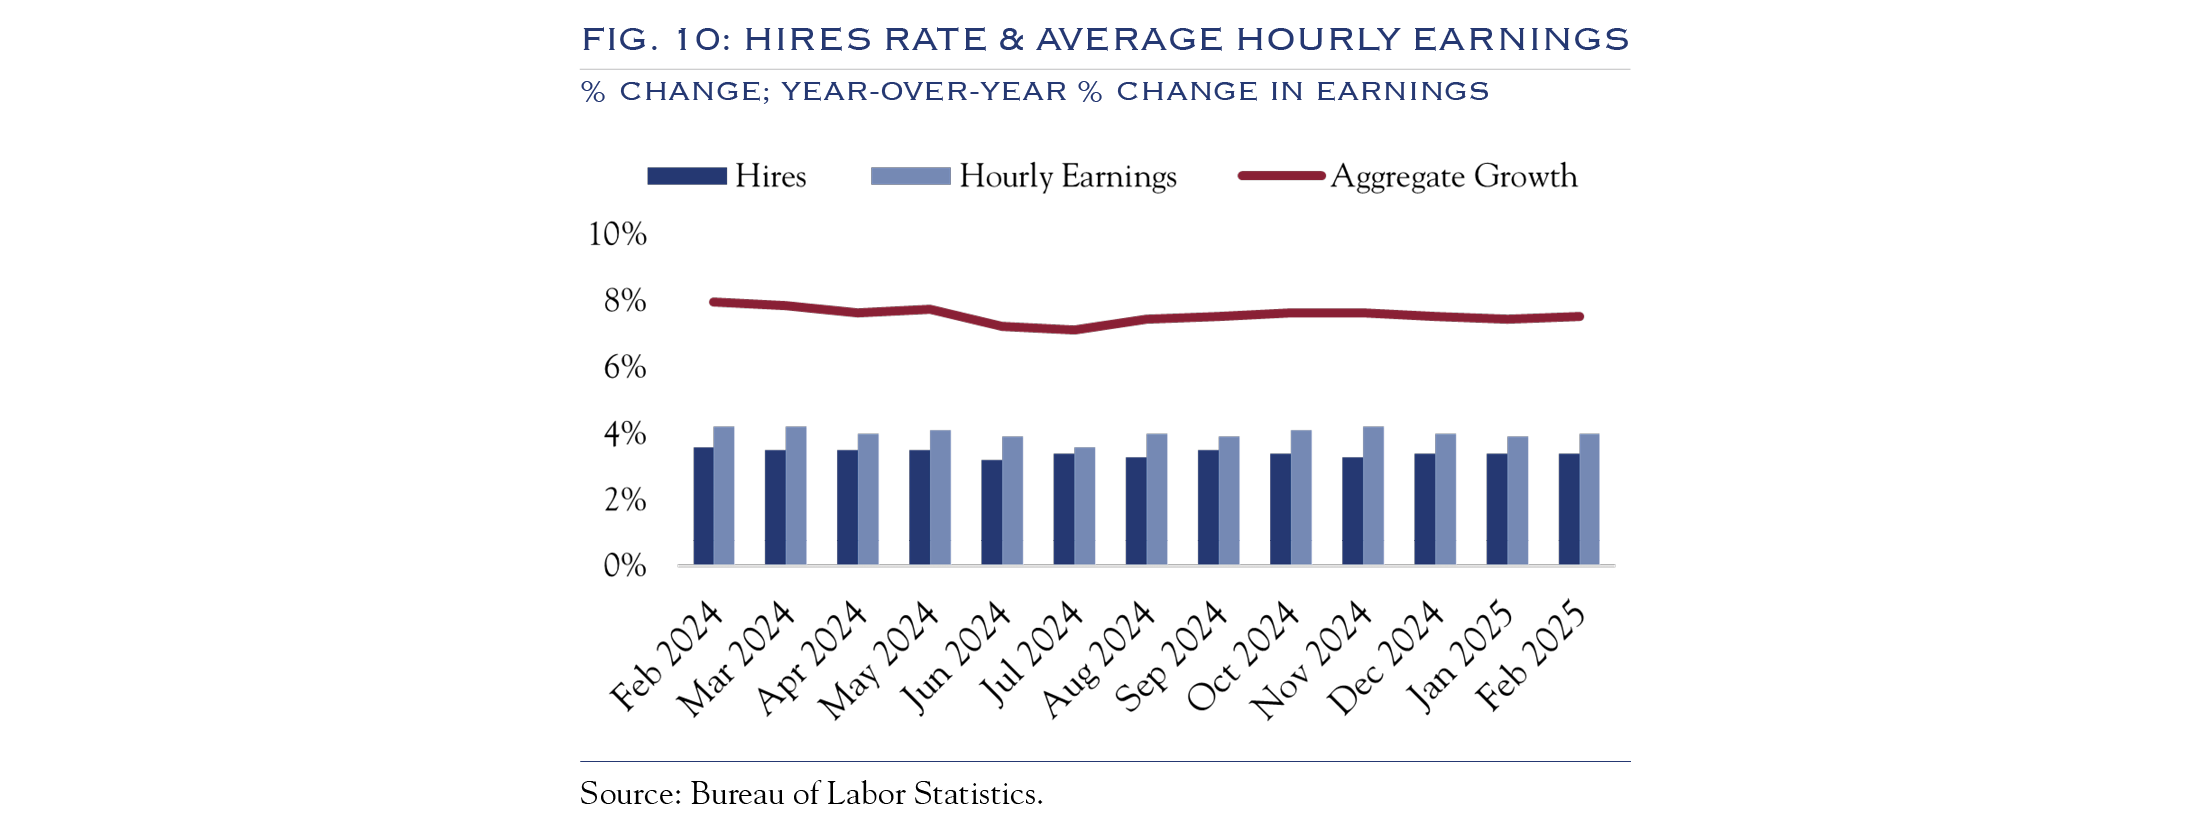
As shown in Figure 10, the expansion rate in U.S. payrolls is currently +3.4%. As measured by average hourly earnings, wage gains are currently running at +4.0%. That wage gain figure is nominal, and the real average hourly earnings figure (adjusted for inflation) is +1.2%. Roughly speaking, with payrolls expanding and wages increasing, the overall spending power of the consumer is growing. However, other important issues, such as the wealth effect, changes in savings rates, and levels of indebtedness, come into play. Further, while the consumer is the largest segment of the U.S. economy, it is not the only segment. Government spending, investment, and the import/export balance are also factors. Nonetheless, a recession is highly unlikely as long as payrolls and wages continue to expand.
Consumers are less ebullient than in recent years. Sentiment surveys, anecdotal commentary from consumer-facing companies, and data points on items like auto loans and credit cards are among the metrics showing that stress is building, at least for some segments of the economy. Further, if equity market losses build, the “wealth effect” would turn negative, perhaps prompting a pullback across a broader swath of the economy.
The economy is downshifting, though it should settle in along the long-term trend line of approximately 2.0% growth. That number could shift lower if payroll expansion slows or higher if productivity increases. Productivity represents more economic activity per employee. Given the slowing population growth in the U.S., productivity is essential to economic growth.
The employment situation remains the most important driver of economic growth, and while it is cooling, it remains positive.
Inflation & Tariffs
Note: Tariff policy is incredibly important but is also only one of many significant and multifaceted issues unfolding for the economy and markets. This letter was published on April 1, 2025, prior to the April 2 tariff announcement. Our outlook and views embed an assumption of tariff increases. However, given the likelihood of ongoing negotiation and responses, it will take some time, even following April 2, to get to a point of specificity on tariff rates. Stay tuned for additional market commentary.
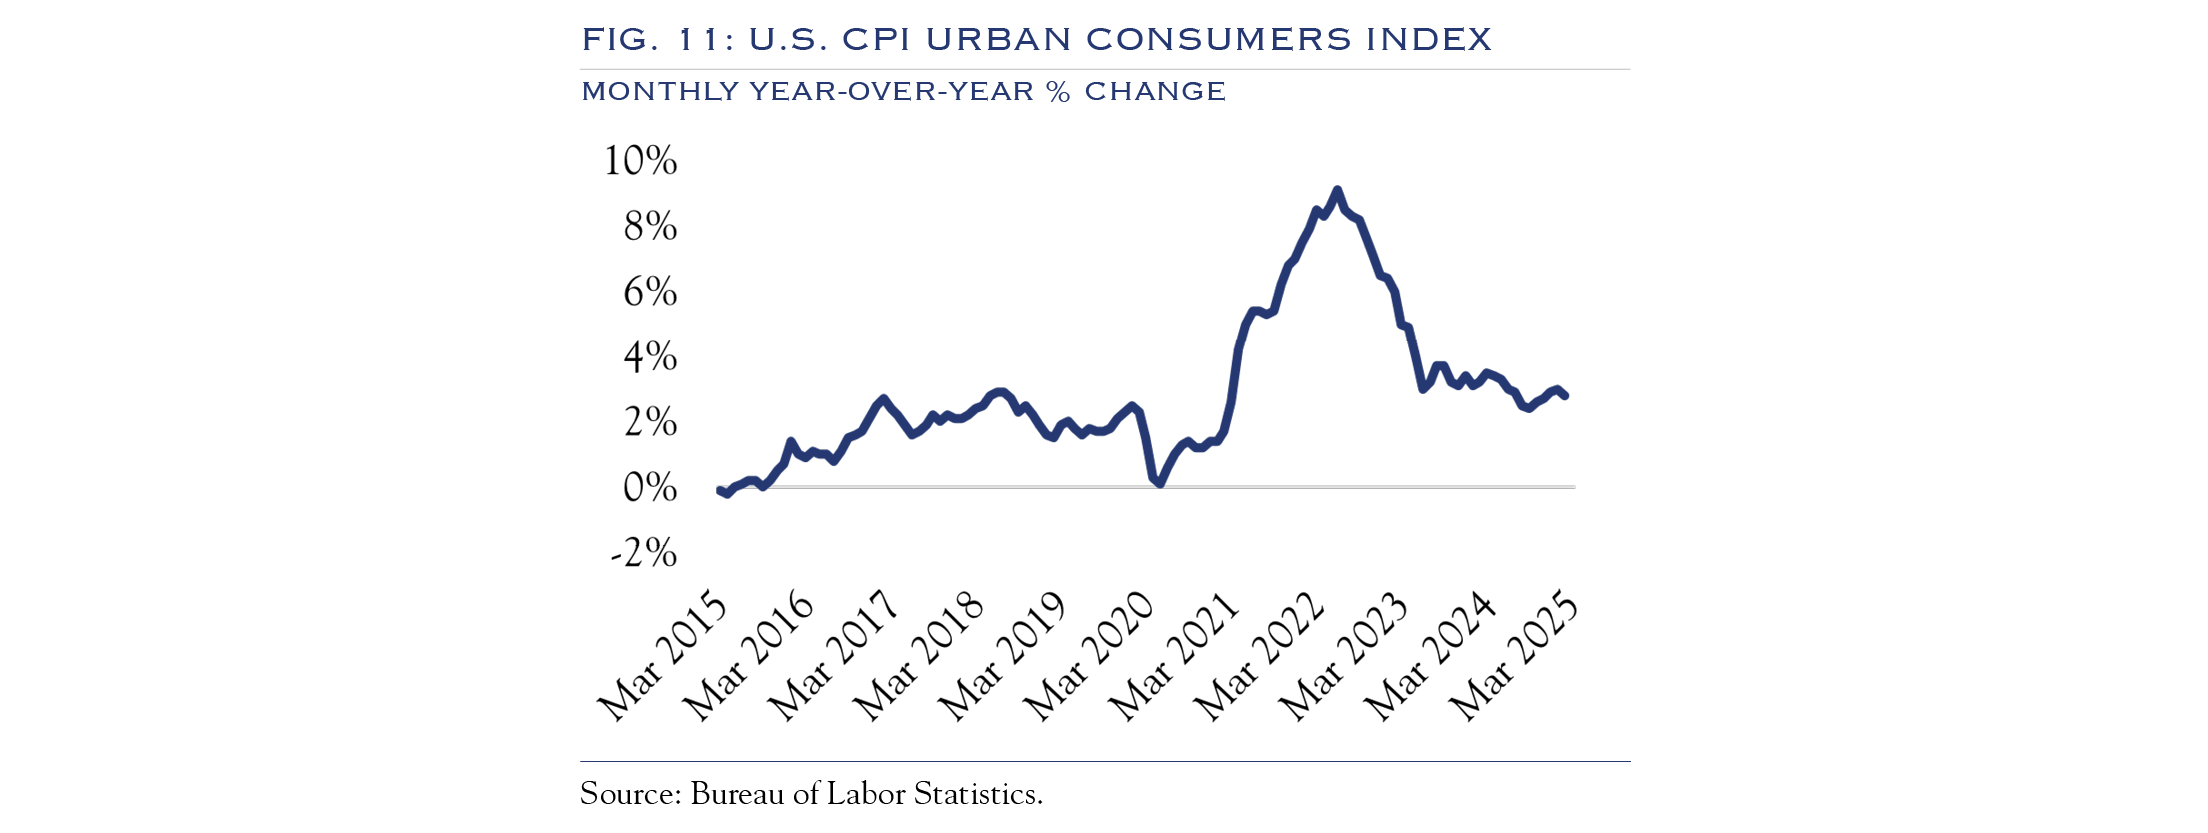
Similar to the labor market, the inflation backdrop is evolving at a slow pace. After peaking at +9.1%, the current reading of +2.8% is much more tolerable, especially considering that the slow-moving Shelter metric represents 1.5%, or 54% of that reading. However, inflation has not yet returned to the Fed’s target rate of 2.0%. Tariffs will play an essential role in inflation readings in the near term. Inflation from tariffs is typically “looked through” as a one-time price adjustment. Tariff policy is likely to evolve over the course of the year. Likely, the intent to implement tariffs in April is meant to fit within the “one-off” adjustment framework. It remains to be seen how extensive and at what level tariffs will be implemented. For context, the range of estimates and our analysis point to a +0.7% increase in CPI, though exemptions and quick substitutions or price absorption by exporters could lessen the blow. Most estimates for inflation, excluding tariffs, anticipate a reduction in CPI of around –0.4% throughout 2025. While tariffs may move inflation in the wrong direction in the near term, the longer-term effects will remain unknown as policy evolves. Nonetheless, inflation will likely remain above the Fed’s target for the foreseeable future.
Fed Policy is Threading the Needle
With a dual mandate for price stability (inflation at 2.0%) and full employment, the Fed must deftly navigate changes in two metrics that require different responses.
The slowing of labor market expansion means that the Fed must be ready to respond if labor market conditions weaken. At the same time, the Fed must retain the credibility it has re-earned in working inflation back to a more normal level. Since inflation could increase via tariff action and labor expansion could slow via policy uncertainty, communication from the Fed will be vital.
At the most recent FOMC meeting, the signal from the Fed was measured and complex. Reducing balance sheet runoff to only $5 billion/month on Treasuries represents a wise, measured step. The Fed seems to recognize that a cut at this juncture (with inflation still elevated and okay growth readings) could be perceived as happening for “bad” reasons, i.e., weaker growth. The balance sheet move, which slightly improves supply/demand for Treasuries, is a way to signal that lower rates are acceptable without spooking the market. The Fed is playing for time and wants to extend the growth runway beyond this period of policy uncertainty.
Interest Rates
The intricate web of Fed policy, White House policy, labor market dynamics, and inflation makes for a volatile period for interest rates. As shown in Figure 4, the MOVE Index of bond market volatility resides near long-term average readings, though well above the norm for the post-financial crisis period. This is because each data point on policy, jobs, and inflation—and there are many—is causing a strong reaction in yields. Overall, rates have been trending lower in 2025, and this trend will continue.
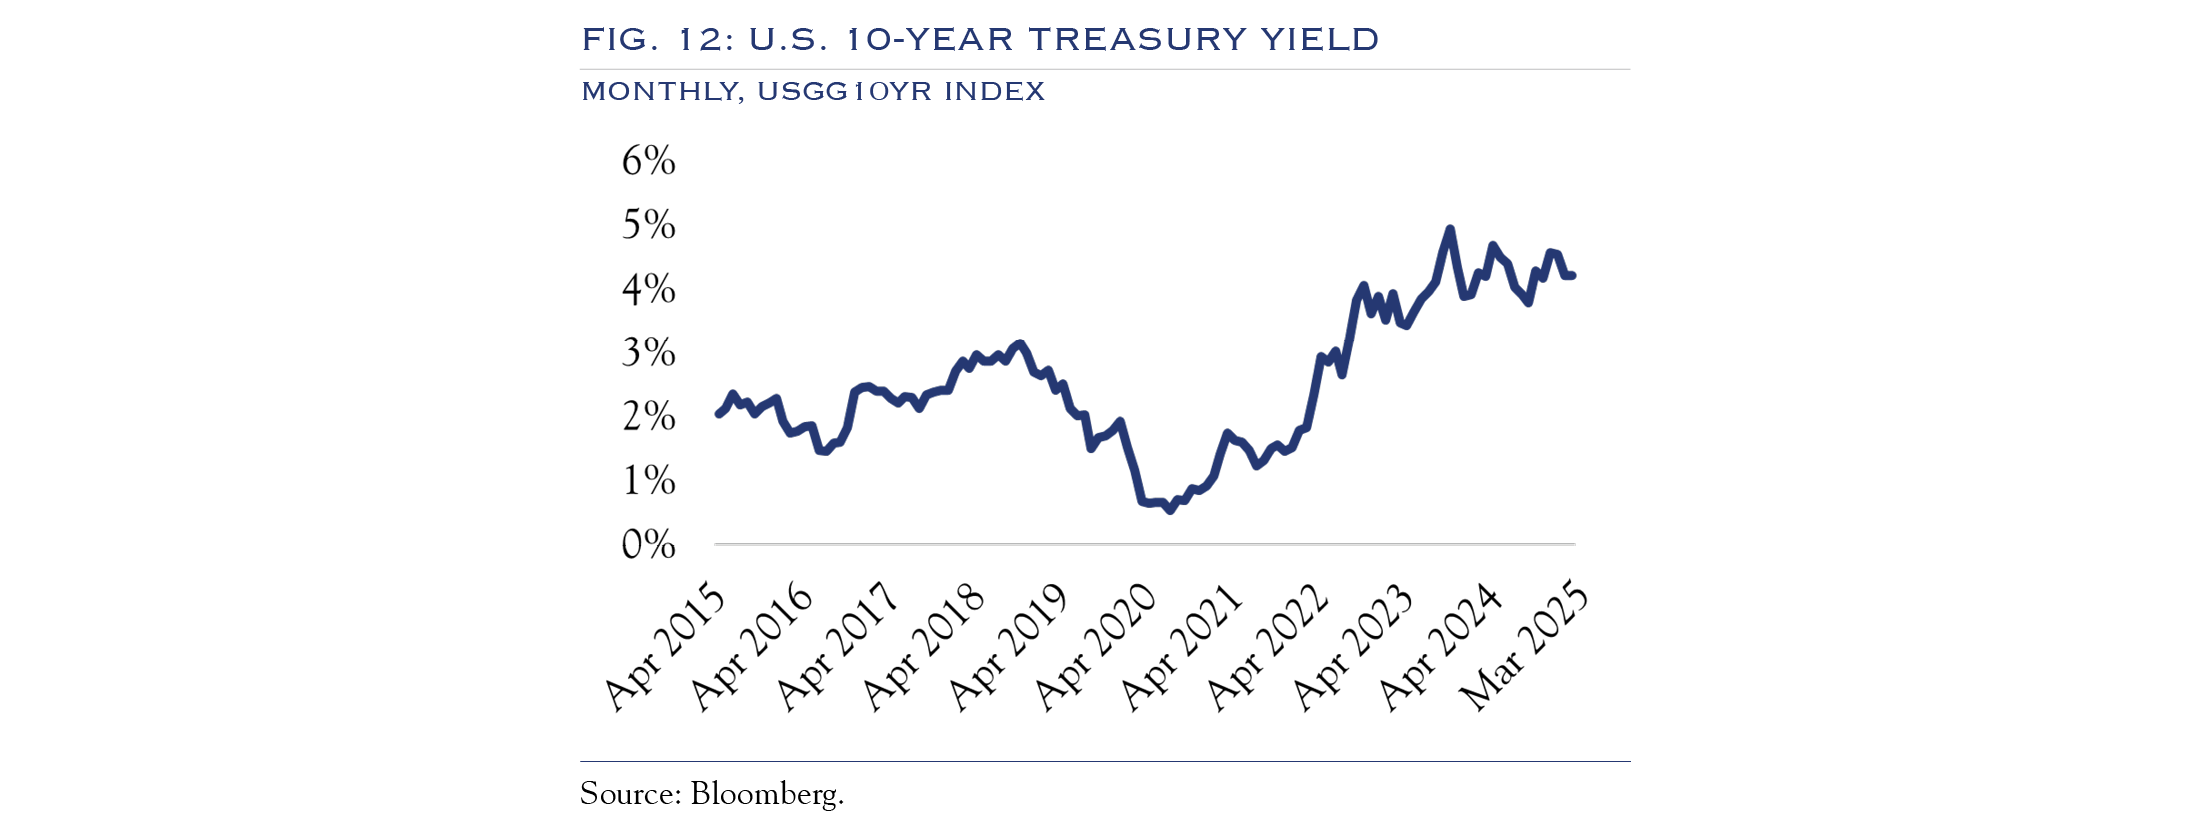
A simple model we consider in this environment for assessing yield on the U.S. Ten Year Note is to evaluate inflation vs. target and the Fed Funds rate vs. a normal long-term average (r*) reading. Very roughly speaking, Fed Funds are at 4.5%, and eventually, the rate should drop to 3.0% (or a little lower) under normal conditions for inflation and the economy. The 10-year Treasury Yield is 4.3%, and this level should roughly track Fed Funds. Per the Fed’s preferred metric of core PCE, inflation is 2.6% or 0.6% above target. For each 0.1% drop in inflation, Fed Fund and Treasury yields should drop 0.2–0.3%. While tariffs may obstruct the path in the short term, in the longer term, inflation will normalize, and rates will follow the path to “normal.”
Valuation & Expectations
Though valuations have come down a touch compared to the start of the year, they remain in the top quartile compared to the past 30 years.
We use a multi-factor model to assess current and expected “fair value” for valuation. The model looks at historical ranges across inflation, interest rates, sentiment, exposure, domestic policy, and geopolitics.
- Inflation: Inflation remains elevated, but only modestly so, and it will improve gradually. This should provide a modest lift to valuation.
- Interest Rates: Rates are modest compared to their long-term history and elevated compared to the sustained low rates seen in the post-financial crisis era. Rates will gradually follow inflation and Fed Funds to modestly lower levels, which will help support valuation going forward.
- Sentiment: Entering the year, sentiment was very bullish. It is now more neutral/bearish, leaving room for future improvement and a lift to valuation.
- Equity Exposure: Like sentiment, exposure levels were high entering the year. Though there isn’t much room for improvement, they have eased a bit.
- Domestic Policy: Expectations were running very high for favorable policy, so much good news was priced in before turning decidedly negative as unpredictability dominated the headlines. Looking ahead, the policy backdrop should eventually improve.
- Geopolitics: This area remains fraught with uncertainty, though it has settled into a mostly stabilized position. There isn’t much room for future improvement here.
Viewing each against history and in comparison to long-term valuation ranges, valuation levels are reasonable. Given the current level of uncertainty, they are perhaps a touch high, which is why volatility should continue.
As some uncertainty resolves and inflation and rates ease, valuations will be supported at these levels, though they are unlikely to expand. Thus, future returns must come from earnings.
There are three catalysts for the stabilization of valuation metrics:
- Ongoing supportive commentary from the Fed regarding the economy. Chair Powell’s recent commentary was on the right track.
- Earnings season confirmation of sustained consumer spending. Commentaries from early-reporting banks will be especially crucial.
- Market receptiveness to the long-term benefits of Trump administration policies. Treasury Secretary Scott Bessent is shaping up as a strong messenger for this story.
Earnings Outlook
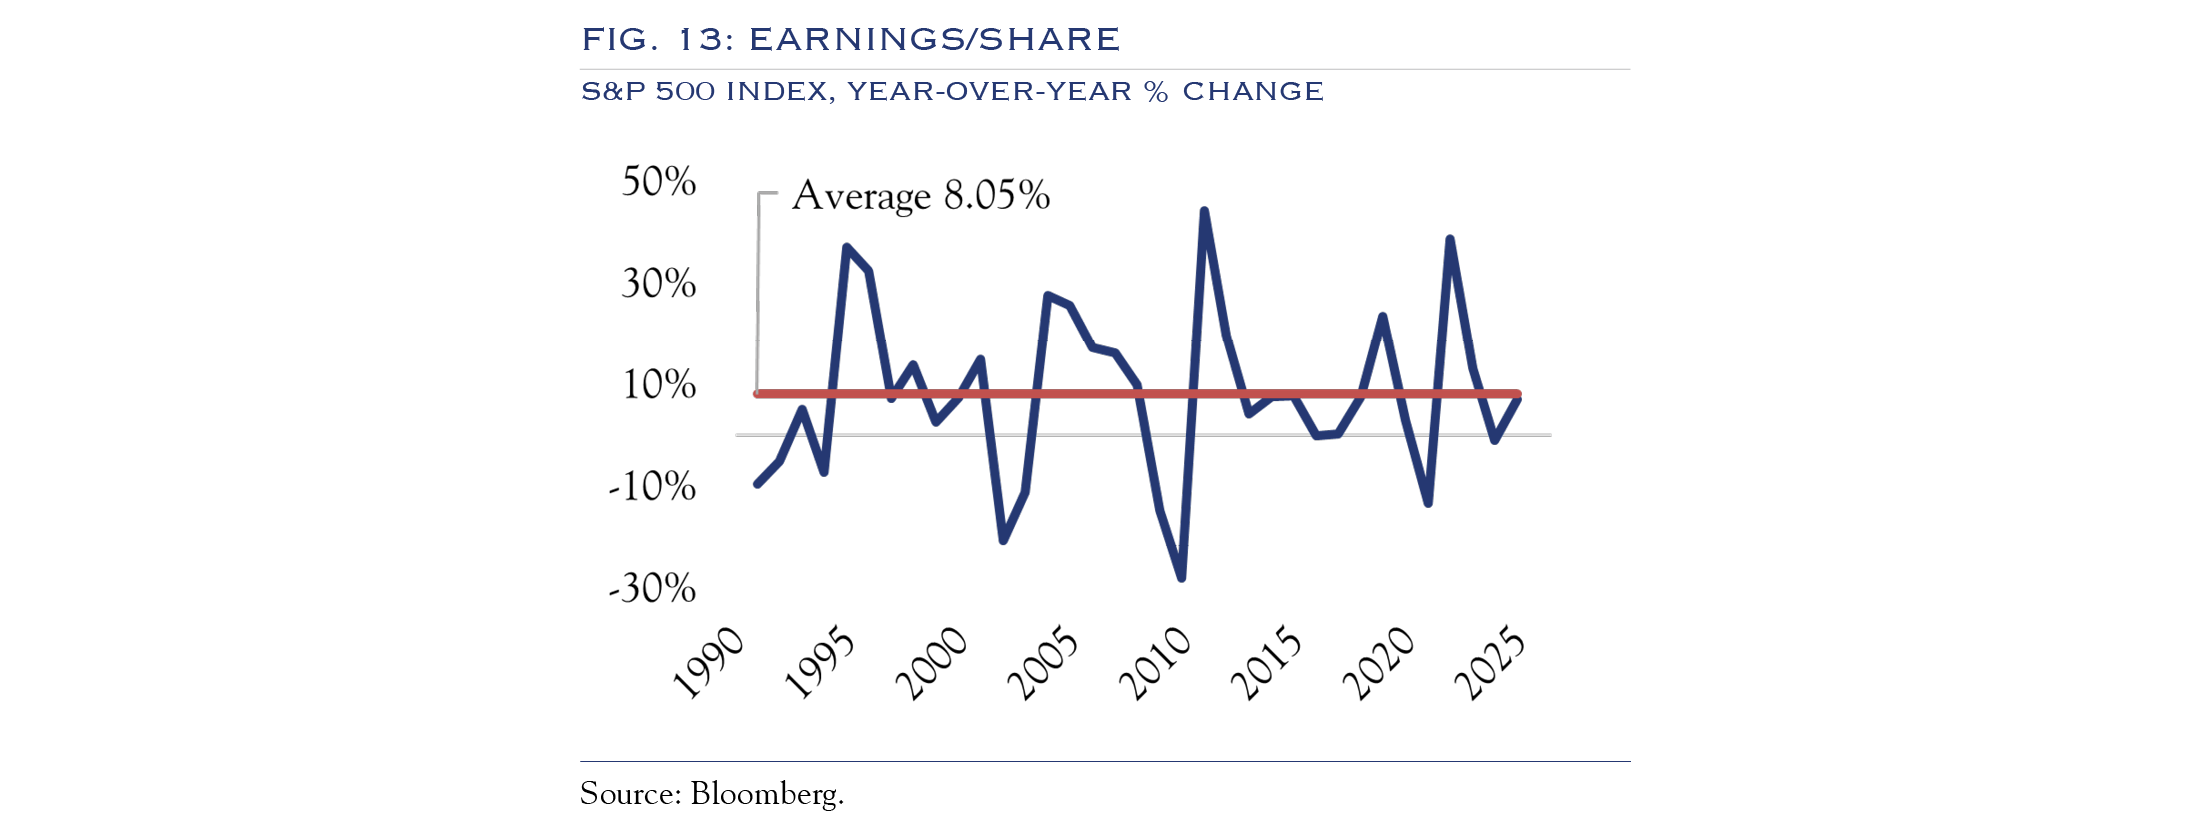
A slowing but steady economic backdrop is almost always favorable for earnings unless economic growth dips to 1.5% or below. Our research shows that GDP of 1.5 to 2.5% is usually consistent with high single-digit earnings gains. However, once growth dips below 1.5%, corporations seem to sense an incoming recession, cutting back activity and sending earnings to flat or negative territory. When growth runs hotter than 2.5%, earnings can explode higher.
For 2025, our base-case scenario is a muted economic backdrop of around 2.0%, fueling earnings gains of 9.0%. The early part of the year may be more challenging as businesses navigate the rapid pace of change. In the long term, there is enormous potential for continued gains in productivity, which will lead to an expansion of profit margins and earnings.
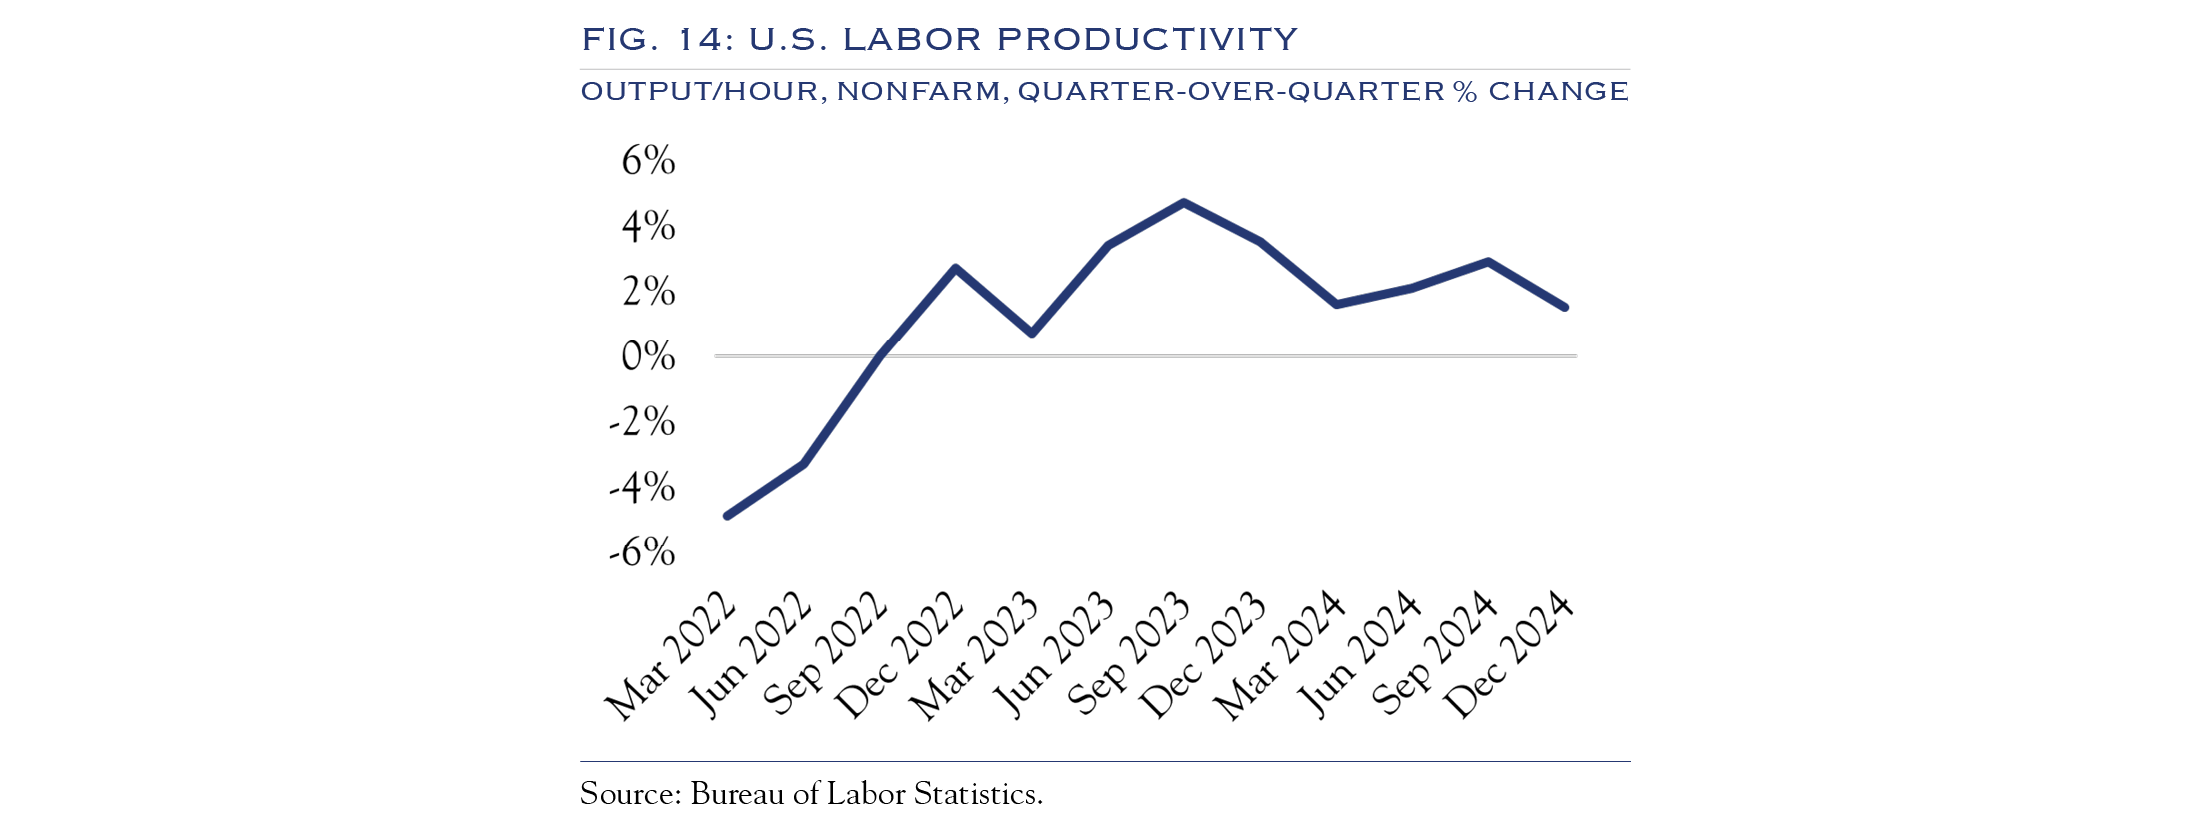
Slowdowns in workforce expansion mean that productivity is the critical source of economic expansion. We are encouraged by many signals that point to an ongoing lift in productivity. This will benefit economic growth, earnings power, and equity returns.
After years of lackluster growth, productivity has been on an uptrend across the U.S. economy.
In a recent research note, the Federal Reserve Bank of Cleveland examined historical and current productivity trends and noted:
“Productivity growth has shown a notable pickup since the fourth quarter of 2019, and some commentators cite artificial intelligence and other factors as reasons why technological progress can sustain this faster pace.”
Research on productivity resulting from using AI contains a wide range of estimates. After sorting through the data, our working estimate is for a 7% boost, derived from 14% gains across 50% of the workforce. This enables an increase in margins from 12.0% to 14.6% (for more, see our article from Insights, “The Three Waves of AI Adoption & The Impact of Technological Innovation on Productivity”).
Recent data supports this estimate. Pennsylvania Governor Josh Shapiro recently commented at Carnegie Mellon University about a pilot program for state employees. In conjunction with the event, the Pennsylvania Office of Administration said that, on average, employees reported saving 95 minutes per day (8 hours per week) when using ChatGPT. The Federal Reserve Bank of St. Louis’s November 2024 survey on AI usage found an average time savings of 5.4% of work hours.
Anecdotes from companies and a softening hiring environment for white-collar workers support our theory on how AI will spread. Headcount will substantially lag revenue growth as companies realize they can do more with the same headcount supplemented by AI. That said, there should not be large-scale layoffs.
These are early days, and the trends will intensify. Further, the data above applies only to AI. Rapid changes in the usage, productivity, and cost efficiency of robotics will provide an additional boost to productivity.
There is a significant opportunity to increase productivity, profit margins, and earnings.
Outlook
Equities
Volatility will continue as high valuations carry high expectations. Since policy news is likely unpredictable, short-term volatility will persist. We are also highly attuned to any change in signal from corporates in the upcoming earnings season. If additional signs of consumer weakness emerge, further declines could occur. However, over a longer time frame, modest economic growth and significant productivity gains should improve profit margins and drive earnings (and stocks) higher.
Fixed Income
Duration is a tricky decision as there is some conflict between short-term and longer-term influences. The market remains highly sensitive to changes in inflation. In the near term, yields are likely to remain mostly rangebound but with higher-than-normal volatility. In the long term, rates should slowly follow inflation and Fed Funds to lower levels.
On the credit front, we remain as cautious as ever. Spreads aren’t especially rewarding compared to historical norms, and while the economy is still expanding, it is clearly downshifting. This could pressure lower-quality companies, and we advocate for diligent, security-specific analysis regarding credit risk.
Growth/Value
Productivity trends will be significant drivers of dispersion, more so than traditional growth or value segmentation. While Health Care (within value) seems to offer the potential for strong margin gains, Financials (also within value) are subject to risks that accompany a slowing economy. The growth side of the equation faces challenges as well, particularly with elevated valuations in some areas. We recommend a balance between growth and value and a focus on security selection to identify winners in the race for productivity.
Large/Small
The small-cap rebound has been delayed yet again, falling victim to a turbulent policy backdrop that has scuppered the M&A activity that is traditionally a powerful catalyst for smaller company stocks. As a point of reference, North American M&A activity was roughly flat for the first quarter compared to the first quarter of 2024. Policy change should abate sometime between now and the midterm election cycle, allowing some runway for deal planning and execution and helping small-cap valuations. There will be some convergence of earnings growth between large and small caps as productivity-enhancing tools (such as AI and robotics) become more widely available. A significant drop in interest rates will likely take time, but it will also benefit small caps, as they are more sensitive to financial conditions than larger companies. Several potential catalysts are in place for small-cap outperformance, but correctly gauging the timeline remains challenging, especially in a macro- and policy-driven environment.
U.S./Non-U.S.
Year-to-date results have been encouraging for many equity indices outside the United States. While there is ample opportunity for security selection, given the abundance of excellent companies with modest valuations in overseas markets, the United States still retains a stronger economic and demographic backdrop. For now, much of the rally in non-U.S. markets can be attributed to rebalancing trade due partly to balance allocations after a significant divergence in performance. There is some reversal of flows, but apprehension remains as to whether this will continue. We continue to recommend modest exposure to non-U.S. markets.
This communication contains the personal opinions, as of the date set forth herein, about the securities, investments and/or economic subjects discussed by Mr. Teeter. No part of Mr. Teeter’s compensation was, is or will be related to any specific views contained in these materials. This communication is intended for information purposes only and does not recommend or solicit the purchase or sale of specific securities or investment services. Readers should not infer or assume that any securities, sectors or markets described were or will be profitable or are appropriate to meet the objectives, situation or needs of a particular individual or family, as the implementation of any financial strategy should only be made after consultation with your attorney, tax advisor and investment advisor. All material presented is compiled from sources believed to be reliable, but accuracy or completeness cannot be guaranteed.
© Silvercrest Asset Management Group LLC


