Introduction
In the 1940s, while working on long-range weather forecasts, a team of statisticians realized that their predictions were no better than chance. When asked to be relieved of their duties, they were told, “The Commanding General is well aware that the forecasts are no good. However, he needs them for planning purposes.”
In December 2024, GenCast, a tool from Google DeepMind, unveiled an artificial intelligence tool that outperformed existing models 97% of the time on 1,320 variables for 15-day forecasts. Data and AI are changing the forecasting game.
Forecasting is a treacherous business. Success rates are fairly miserable for economic and investment forecasters and present an annual exercise in humility for every Wall Street strategist. At Silvercrest, we generally avoid the calendar year guessing game, preferring instead to focus on forming a three-year, forward-looking view. Our research demonstrates that, most of the time, results over a three-year period will be primarily driven by fundamentals.
The foundation of our forecasting is developing a view on economic growth, equity earnings, interest rates, and valuation levels. For each element, we aim to start from a solid understanding of current conditions, remain grounded in history, and adjust based on our interpretation of the likely future path.
The intent is to use our research to inform investment decision-making, aiming to be more right than wrong and adding value through wise decision-making over time. We believe good decisions are formed from data and refined with judgment. We aren’t simply producing a forecast because the commander demands it. We are utilizing a vast trove of data, smart analytic tools, a knowledge of history, and sharp debate from experienced investors throughout our firm. This combination of art and science yields the best insights.
In this inaugural outlook publication, our views are presented in summary form at the start and end of each section, accompanied by a wealth of graphics and detailed commentary. We make some comments on the upcoming calendar year but focus the bulk of our attention on a three-year forward-looking view.
The Economy
The U.S. economy is normalizing and returning to a modest growth rate of 2.0–2.5%.

Jobs
Unemployment ticked up over the past year, rising from 3.7% in January to 4.2%. Dating back to the 1940s, unemployment has averaged 5.7%, and the past 30 years have seen an average of 5.6%. The 3.7% reading in January 2024 was close to the current cycle low of 3.4%.
The job market has remained solid, allowing for decent spending growth and propelling the economy.
Despite the relatively low reading, the recent rise in unemployment has brought the Sahm rule to the forefront of many economic discussions. This rule states that a rise of 0.5% in the unemployment rate is often consistent with recessionary conditions. However, in the post-pandemic period, many traditional rules of thumb have not been applicable, a point Claudia Sahm has repeatedly made in reference to her eponymous indicator. Furthermore, the rise in unemployment briefly hit 0.5% but has trended lower over the past few months.
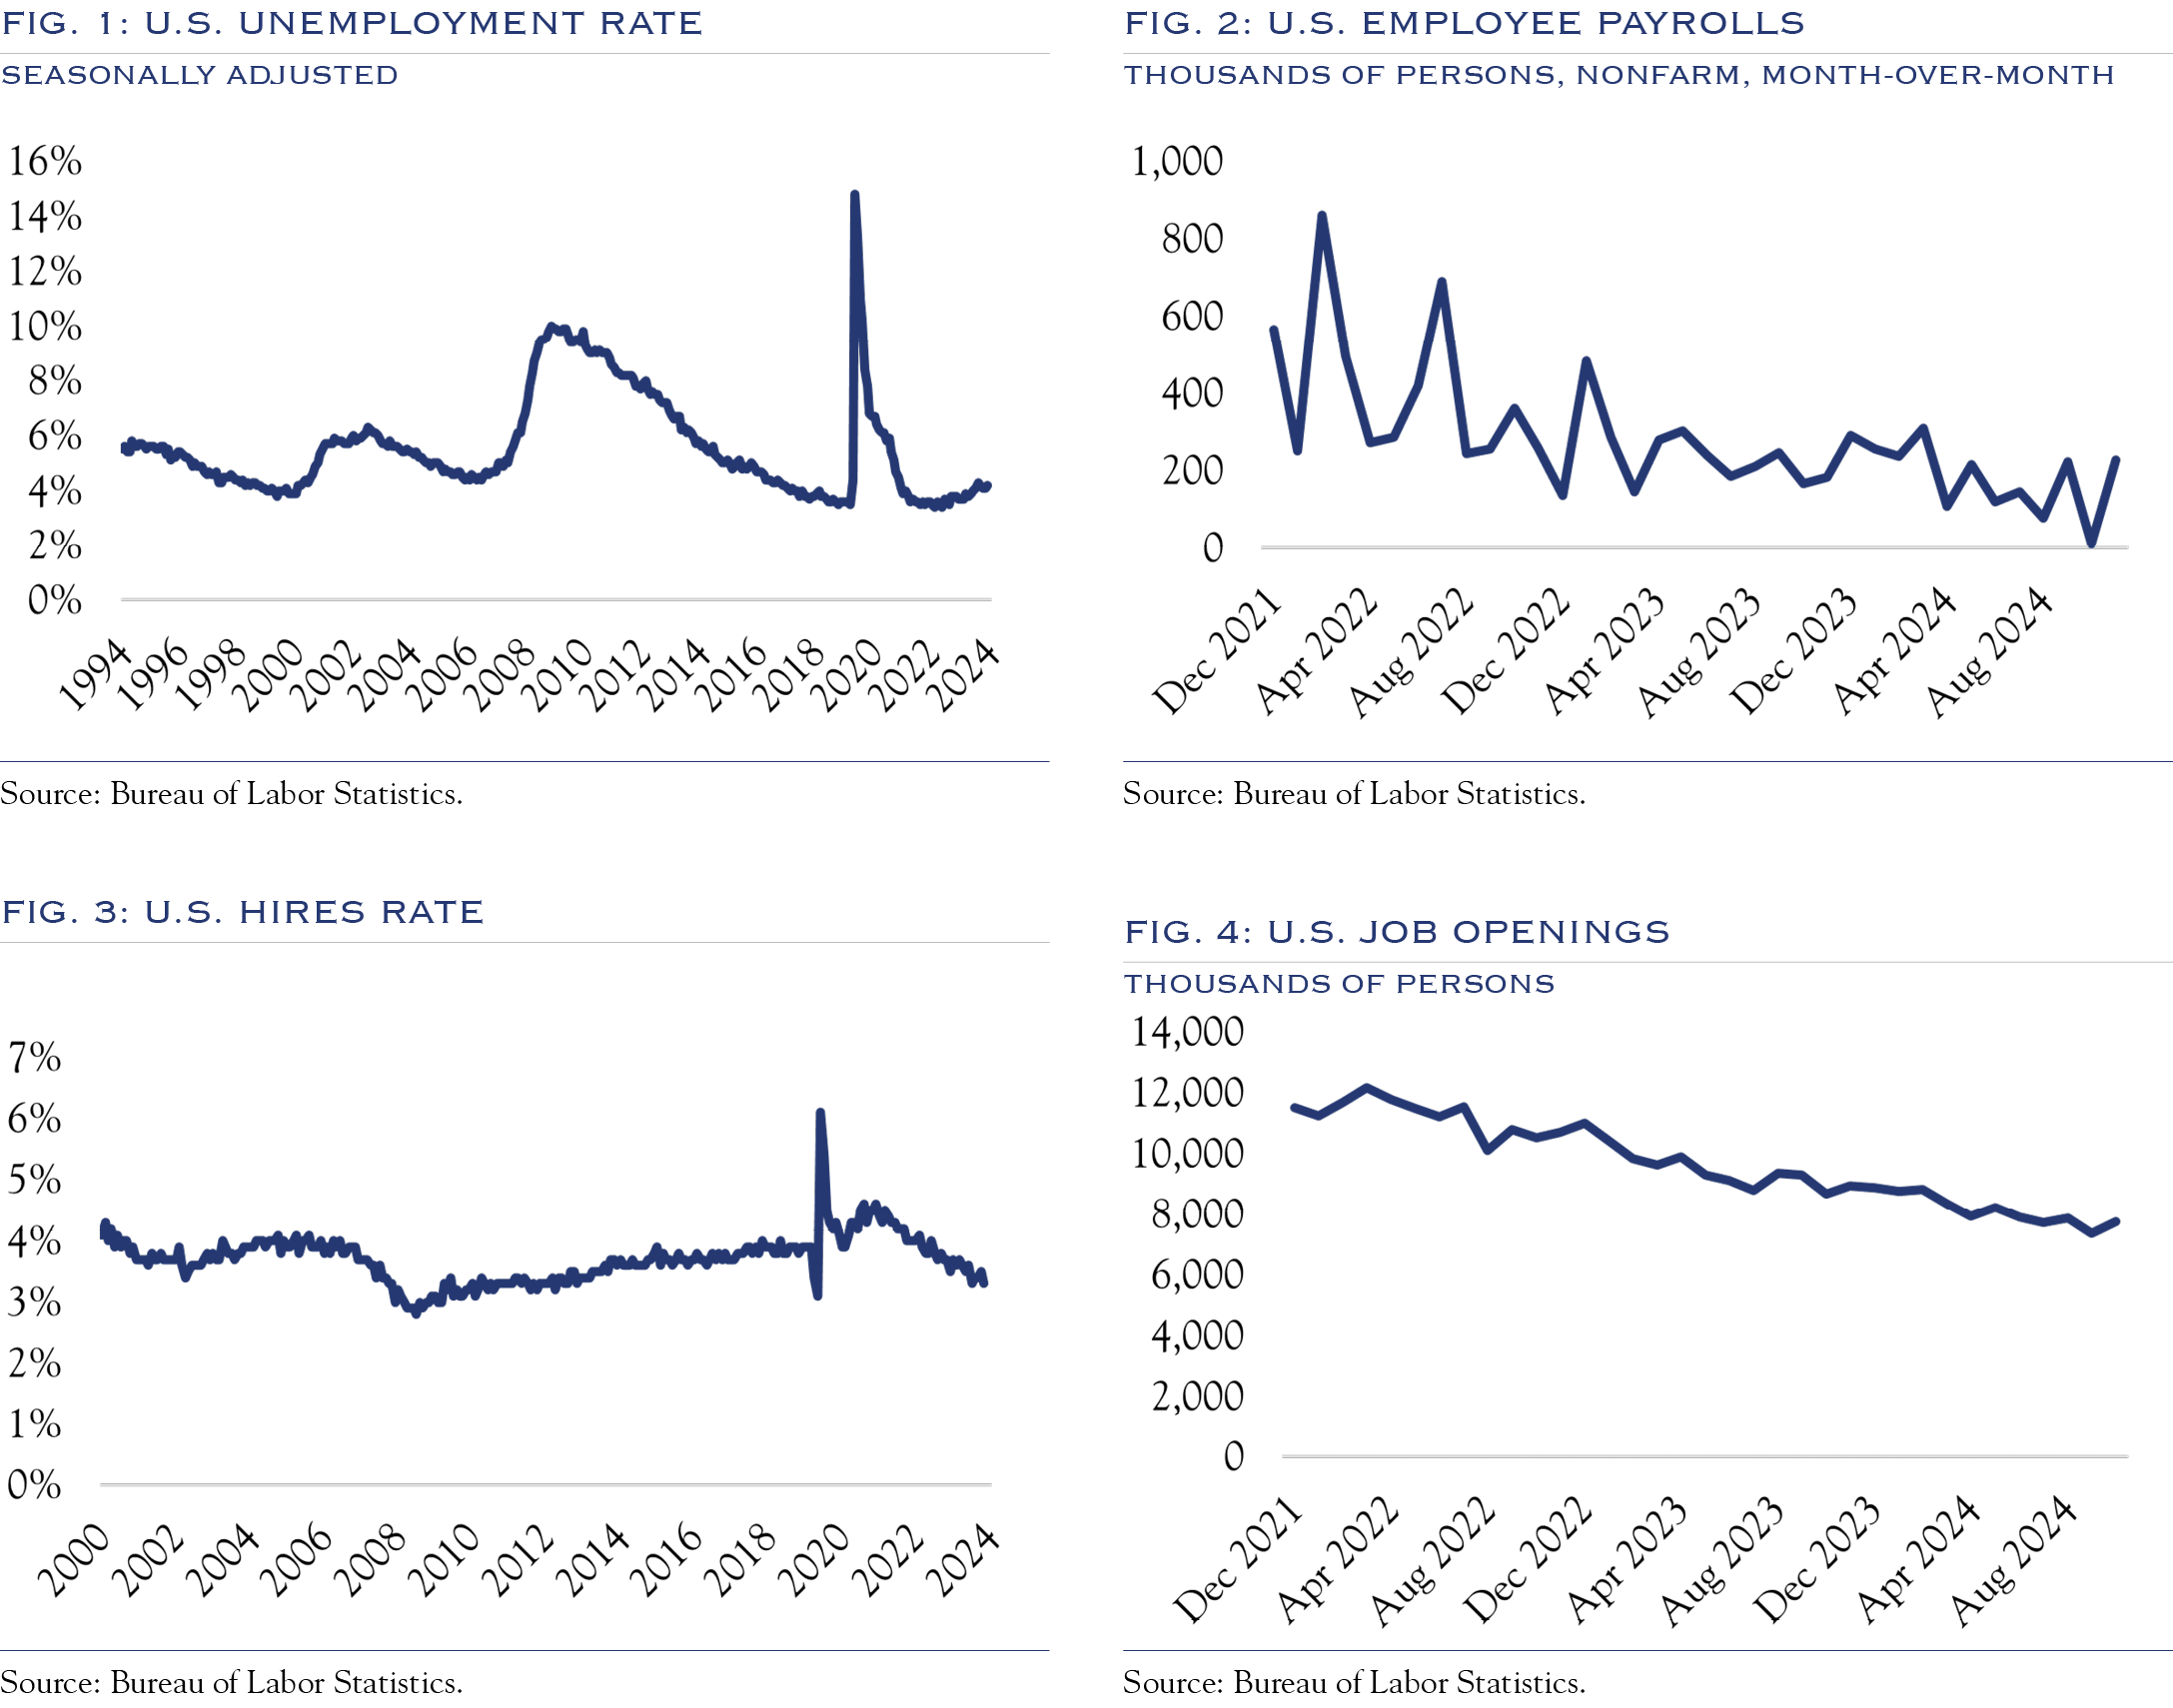
The primary driver of economic expansion in the United States is the continued growth in the labor force. Each month, the jobs report, specifically the change in the number of employees on nonfarm payrolls, is an important data point. Strikes and storms distorted the reading for October, though the six-month average remains a solid 132,000, a touch below the average for the past year of 181,000. We estimate that readings of 125,000+ are consistent with a stable growth backdrop. If readings dip below 50,000 on a sustained basis, we expect to see the unemployment rate move noticeably higher.
We expect job gains to continue because of the still-elevated number of jobs offered. The Job Openings and Labor Turnover Survey measures this figure. In the latest report, as of October, there were 7.74 million job openings in the United States. While this number has dropped significantly from the pandemic-disrupted reading of 12 million, it is above the 6–7 million level typical in the late 2010s. We also closely monitor the Hires Rate, currently 3.3%, which measures the percentage change in hires relative to the labor force. The Hires Rate is at a level that is below average for the five years prior to the pandemic, suggesting a slower-than-normal pace of payroll expansion relative to the size of the labor force.
The labor market continues to expand, albeit at a slowing rate.
Spending
Our review of metrics from banks, Bloomberg Second Measure, Johnson Red Book, consumer mobility evaluation firms, and others points to a consumer spending rate that is healthy overall but with pockets of weakness. The Mastercard Economics Institute estimated U.S. Black Friday spending to be up +3.4% vs. last year, indicating that consumer demand remains strong late into the fourth quarter of 2024. Figure 8 shows the divergence between Walmart and Target in the post-pandemic era. One important macroeconomic dynamic for the health of the consumer was mentioned by Walmart: “Households earning more than $100,000 made up 75% of our share gains.” Historically, this type of migration to Walmart from higher-income consumers can be indicative of building economic stress. For now, this stress hasn’t spread broadly through the economy.
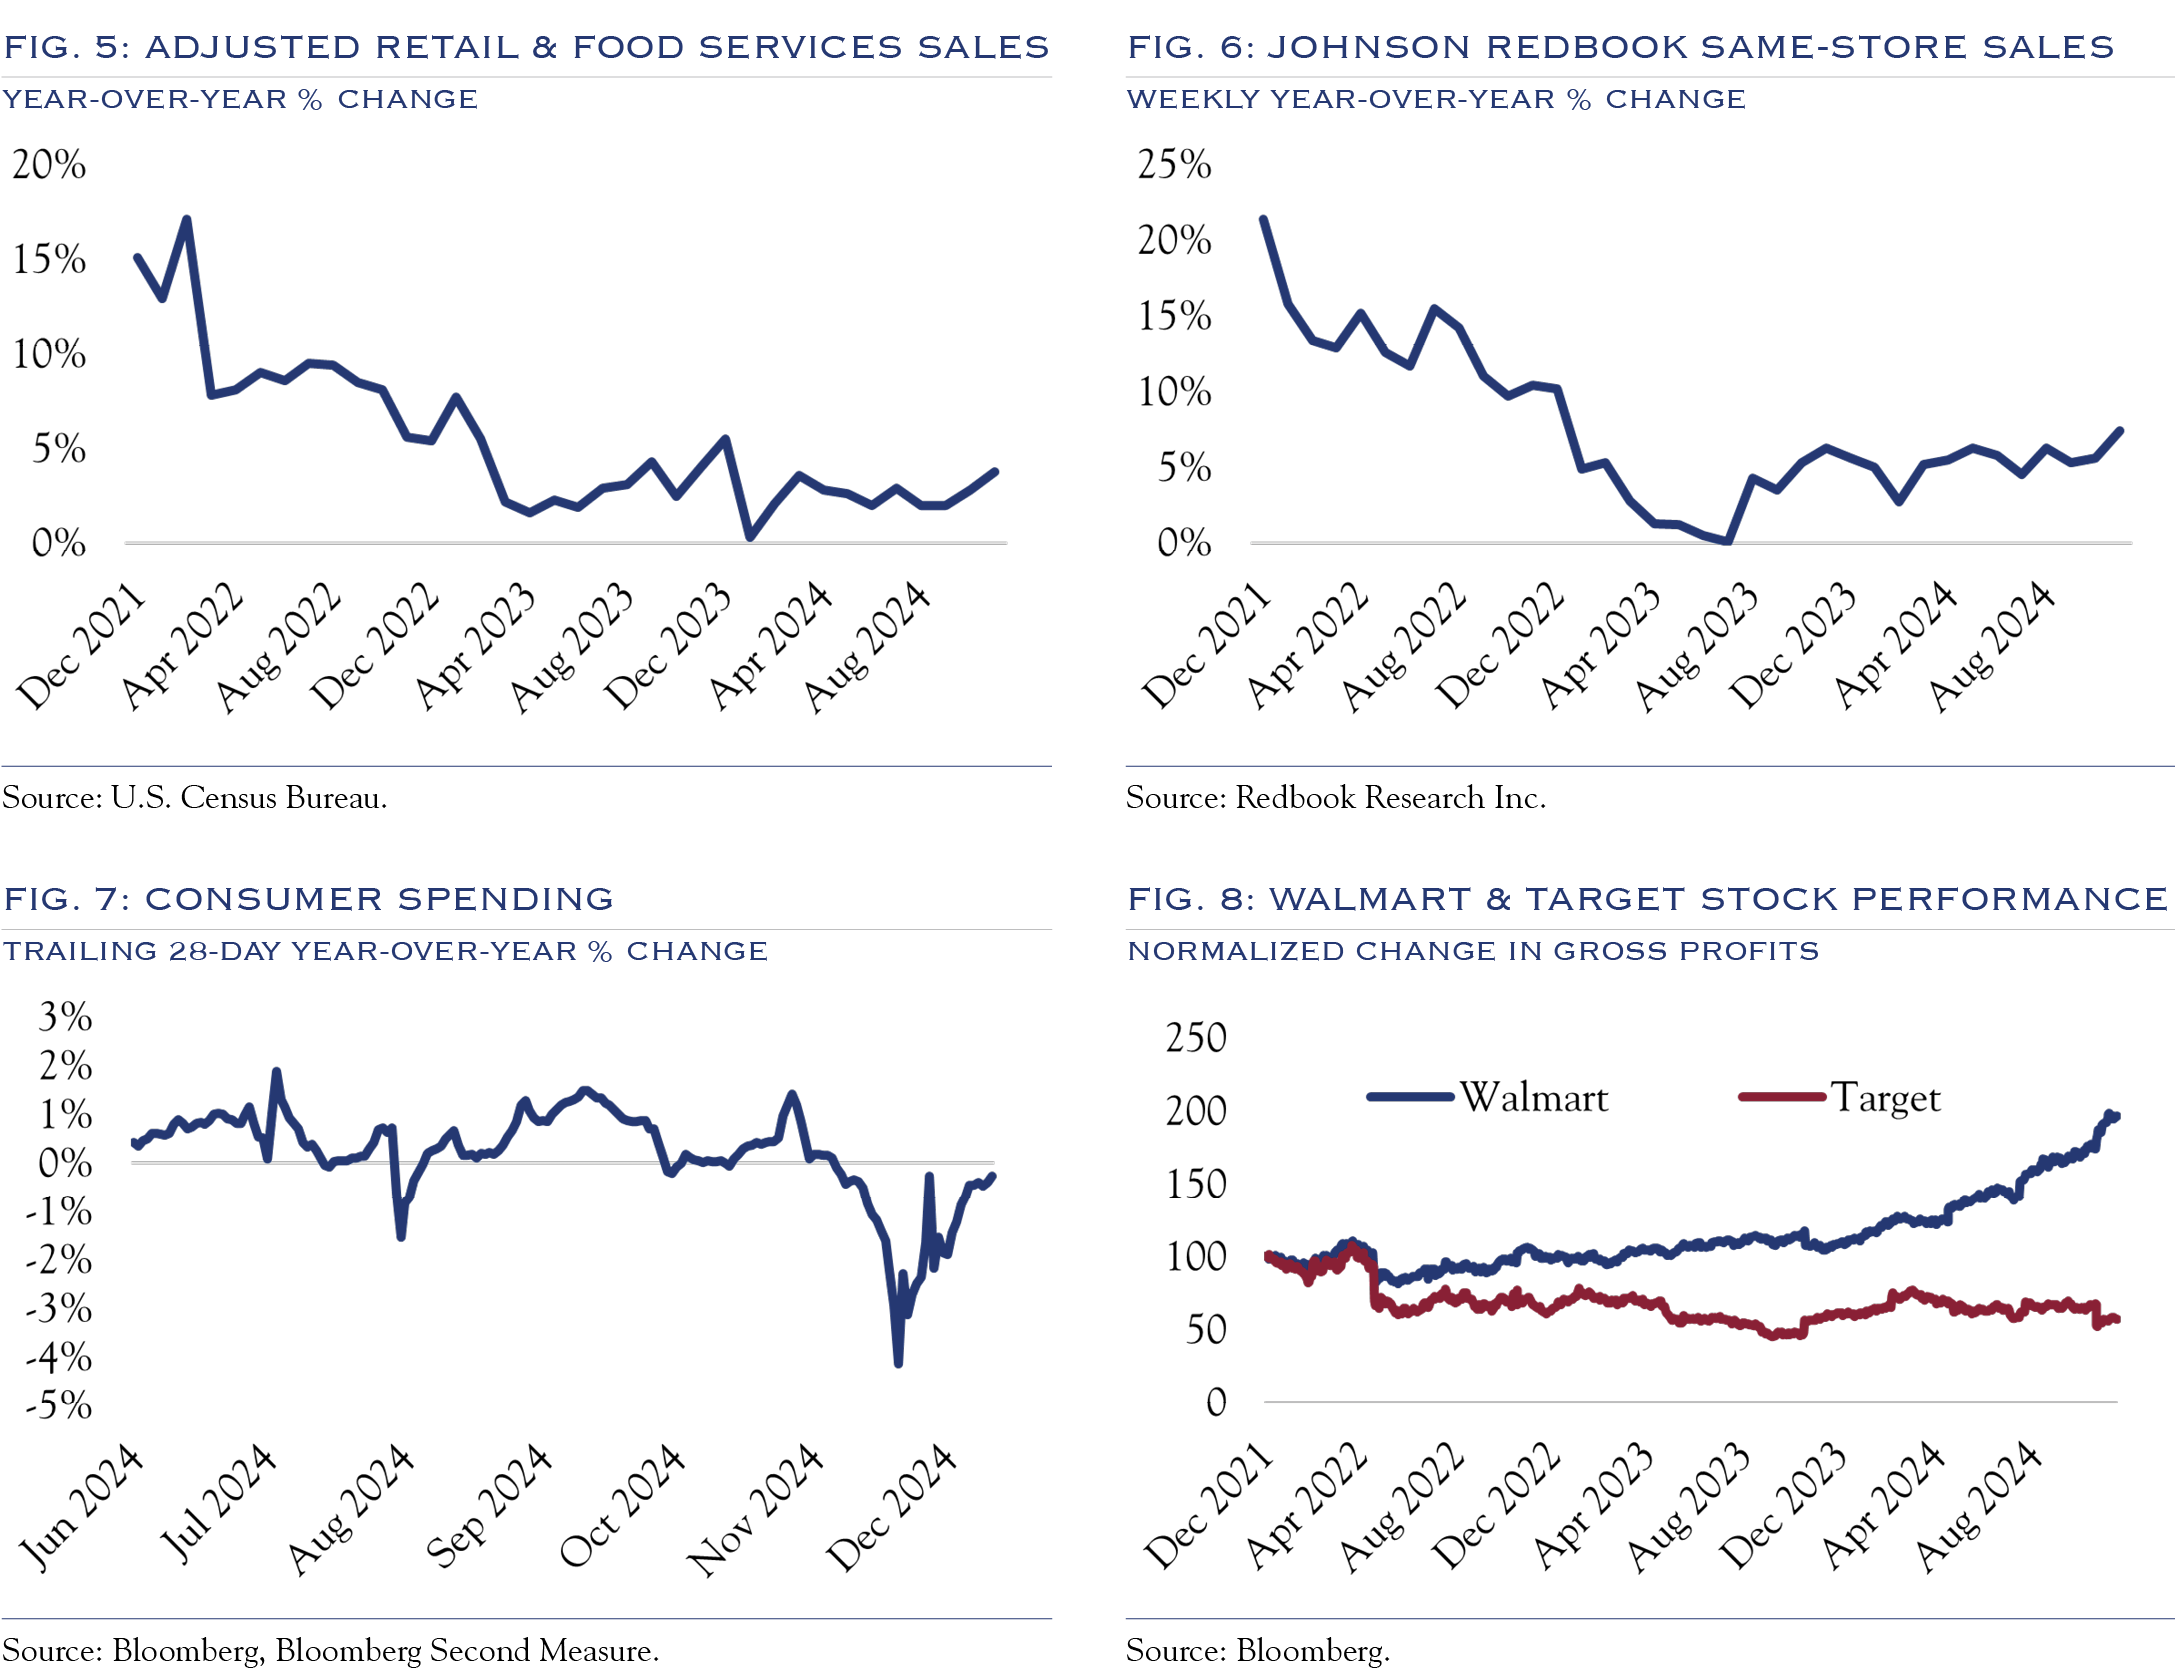
We expect spending to track wage gains at about 2.0% on an inflation-adjusted basis.
Economic Outlook
Where we’ve been: Currently, U.S. GDP growth is running at +2.7%, with estimates of +1.9% for calendar year 2025 from 24 economists as measured by Consensus Economics and +2.1% from 76 economists surveyed by Bloomberg. Average GDP over the past eight quarters has been +3.0%, a touch higher than the past ten-year average of +2.7%. Over the past 20 years, including the Global Financial Crisis, growth has averaged +2.2%. Looking back 30 years, including the high growth in the 1990s, growth has averaged +2.6%.
Where we are: Our research examines real-time economic models produced by the Atlanta Fed and the Dallas Fed, retail sales, consumer spending, consumer mobility, and other real-time metrics.
Long-term potential economic growth in the United States is around 2.0%, subject to changes in population and productivity. We expect the U.S. economy to post slightly higher rates of expansion as productivity gains continue.
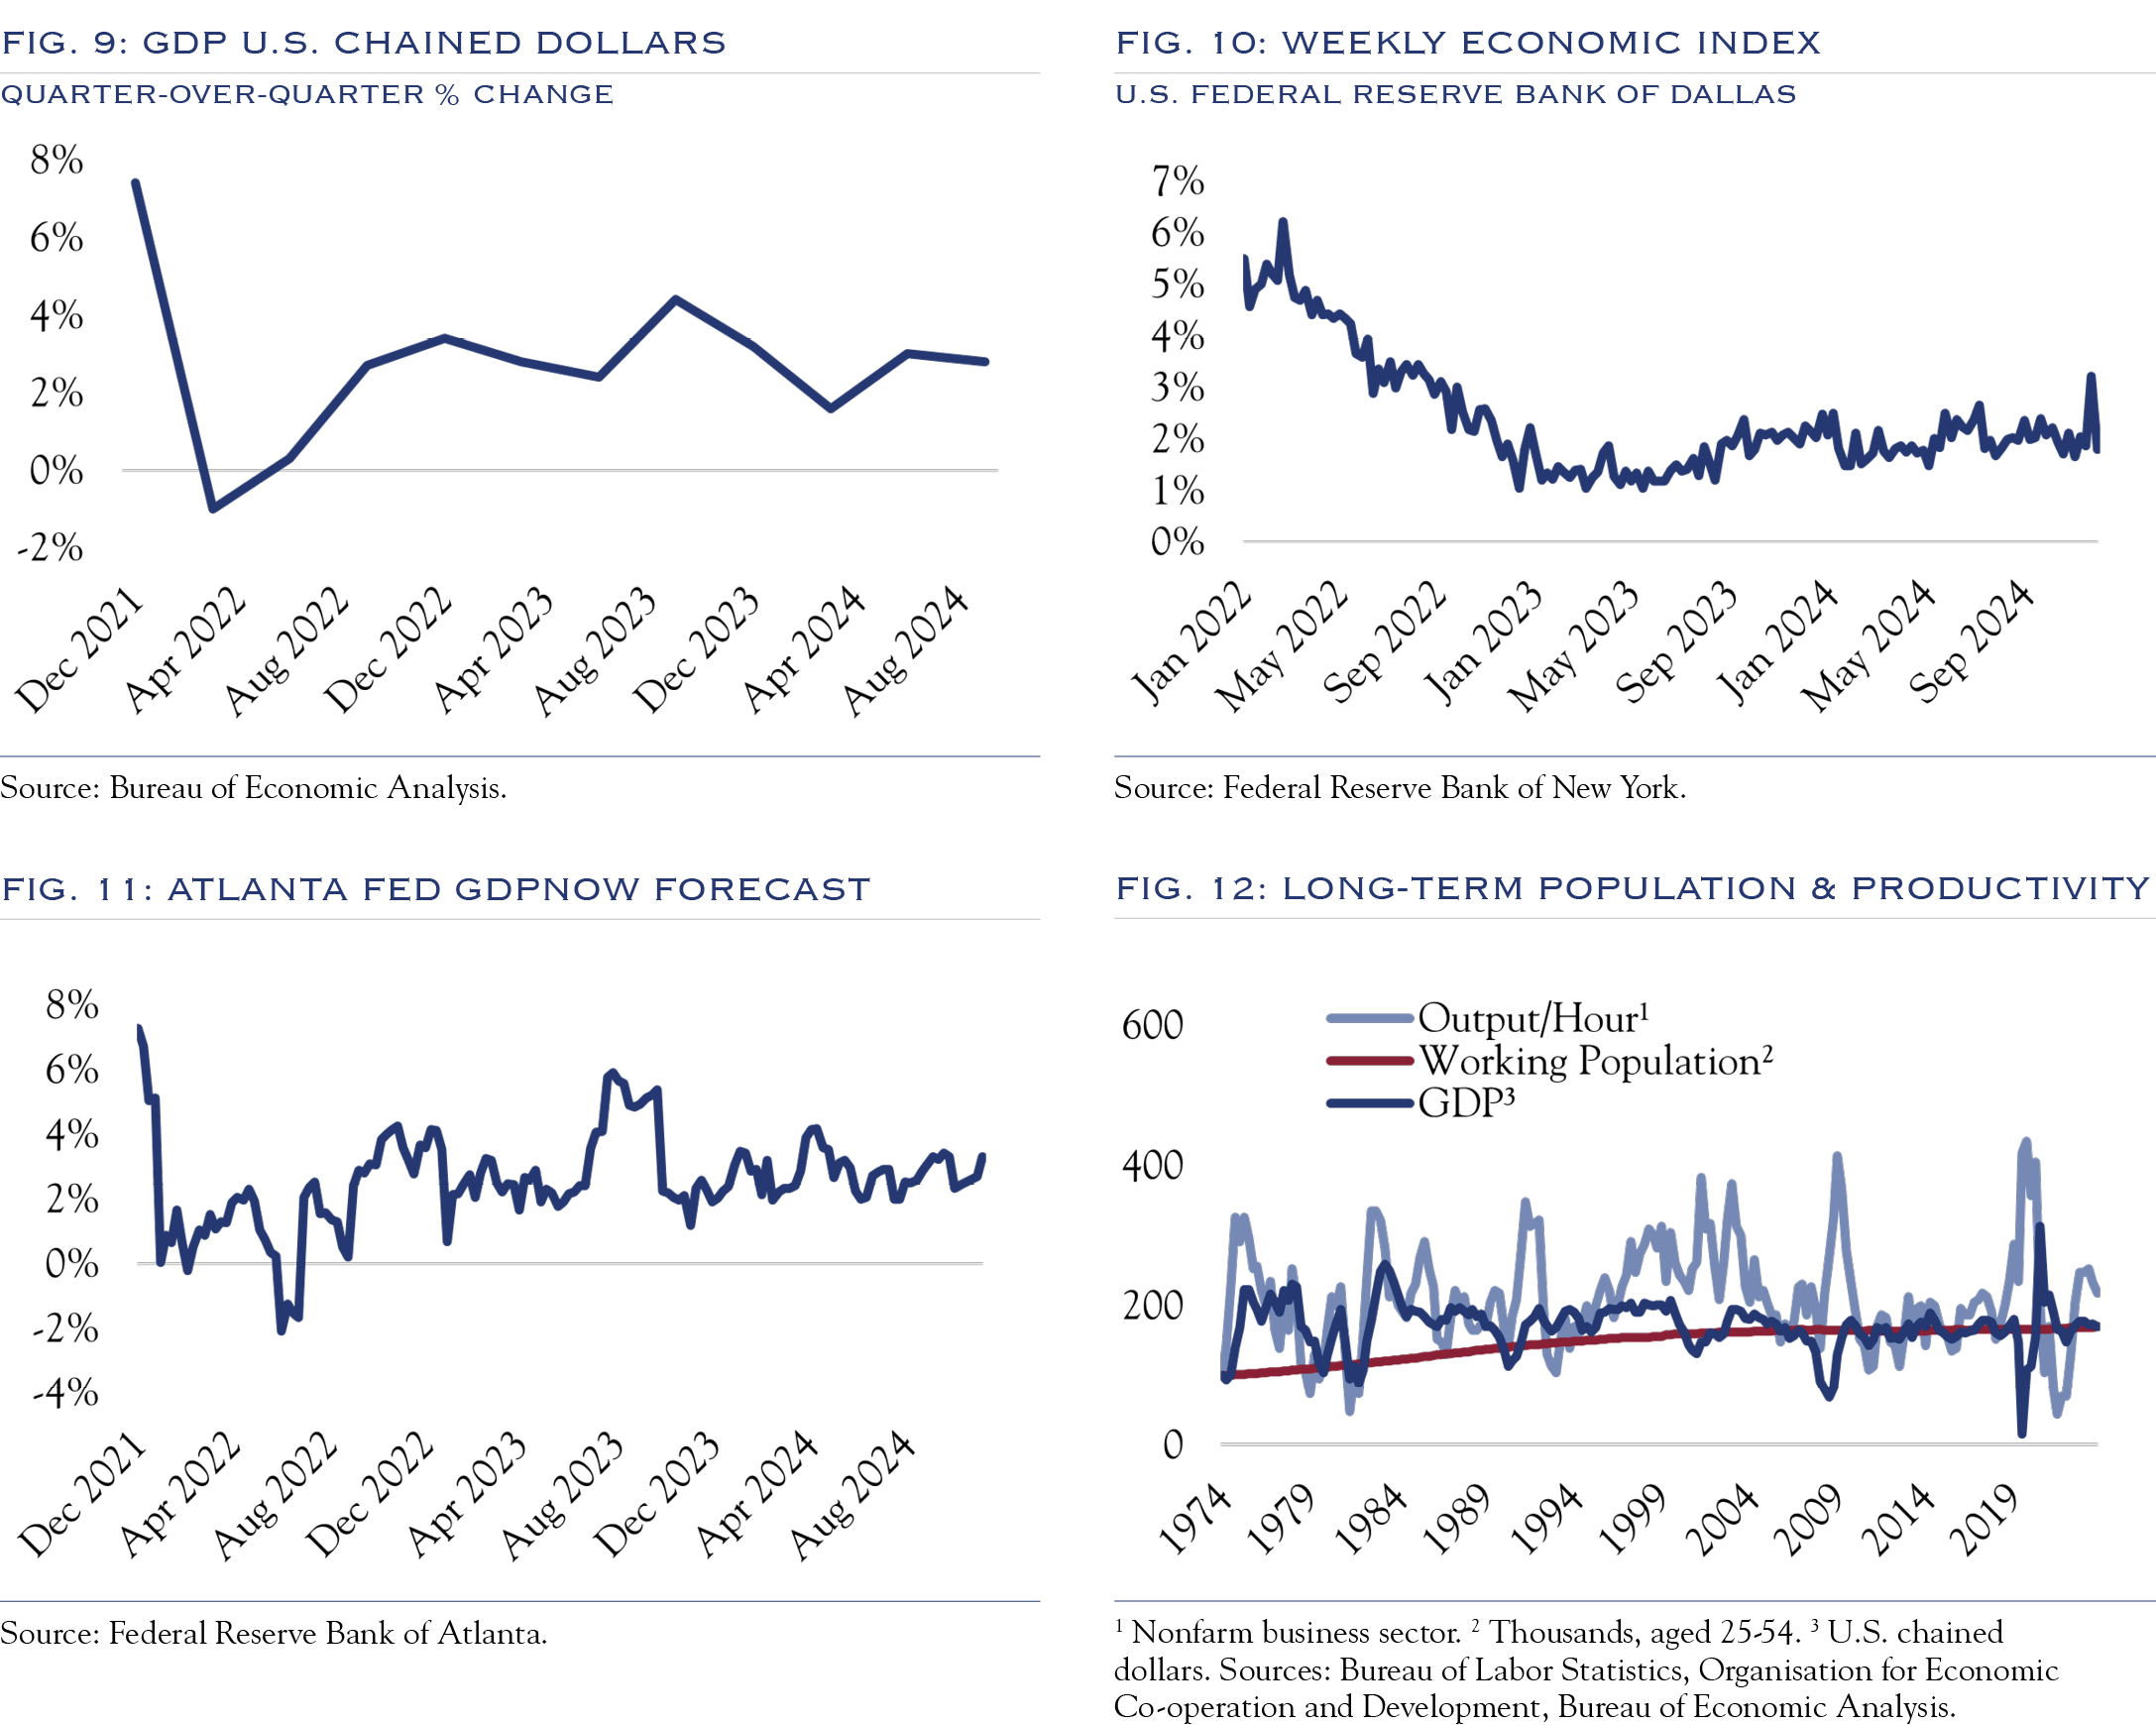
As shown in Figure 10, the Dallas Fed’s Weekly Economic Index (“WEI”) estimates growth at +2.2%, while the Atlanta Fed’s GDPNow model (Figure 11) forecasts +3.3% growth. The GDPNow model evaluates a wide range of reported economic statistics and their historical relationships to estimate current GDP. It has been a better predictor of U.S. GDP in recent quarters. In contrast, the WEI has been projecting a slower growth rate, which reflects the slowdown in some segments of the economy—specifically the goods and lower-income consumer segments. The critical question is whether that slowness spreads to a larger swath of the economy, potentially leading to recession. For now, we see no signs of broad slowness in the economy, mainly due to stability in the labor market.
Over the long term, economic growth is derived from changes in the population, particularly the working-age population, as well as changes in productivity. All else being equal, more population growth and more productivity growth lead to higher economic growth. Figure 12 illustrates this concept. The red line is the long-term trend in working-age population growth. Unlike many other large economies, the U.S. is still experiencing an expansion of population. In periods where the light blue line (productivity) is high or rising, economic growth (the dark blue line) tends to accelerate.
Where we are going: Long-term trends in economic growth are primarily determined by population growth and productivity trends. Growth in the U.S. population is slow but positive, and productivity has long been a hallmark of the U.S. economy. A key determinant of economic growth is whether productivity gains continue at a modest +1.0–1.5% level or accelerate to +2.0% or higher, as it did in the 1990s. We lean towards the higher productivity figures, as we see benefits from further adoption of artificial intelligence tools and advances in robotics. Further, we see U.S. companies as exceptionally dynamic in adapting workflow processes.
The policy mix from the Trump administration is likely to create a complex set of crosscurrents. On balance, we expect the net effect of policy to be positive for U.S. growth owing to the easing of regulatory constraints and a deliberate focus on rebuilding domestic economic activity. However, it is simply too early to fully assess the location, direction, and magnitude of policy change.
Over the next three years, economic growth in the United States will return to long-term trend growth, with growth around +2.0–2.5%.
Rates
Rates will trend lower over the next three years, following the path of inflation and Fed policy.

Inflation
Inflation is a critical piece of the puzzle in forming an investment outlook. As inflation goes, so goes Fed policy and interest rates on the U.S. Ten-Year benchmark. The path and destination of rates will have important investing consequences for all asset classes. In the pre-pandemic era, inflation was widely acknowledged to be thoroughly moribund. Nowadays, inflation has been well above 2.0% for over three years, finally dipping below 3.0% in July 2024 and currently running at 2.7%.
Inflation is near the Fed’s target, though 2025 may see minimal progress. With a slower-growth backdrop and a range of competitive dynamics, inflation will continue to decline over a three-year period.
One reason for the slow return to lower inflation has been the persistent contribution from Shelter. When inflation measured by the Consumer Price Index (“CPI”) was regularly running around 2.0%, Shelter (the largest component weight in CPI) contributed 1.0% or about half of the total. Presently, Shelter is contributing 1.7%, which is 63% of the total. After peaking at a contribution of 2.6%, Shelter costs have been heading lower.
Starting in June 2024, overall inflation declined whereby if shelter contributed at a historically normal level, inflation would be at the Fed’s 2.0% target. This is one reason the Fed began to normalize rate policy with rate cuts. The mechanics of Shelter inflation costs make them slow to move. Market rates for rents and house prices have been stable and should trend lower over time, bringing overall inflation close to normal levels.
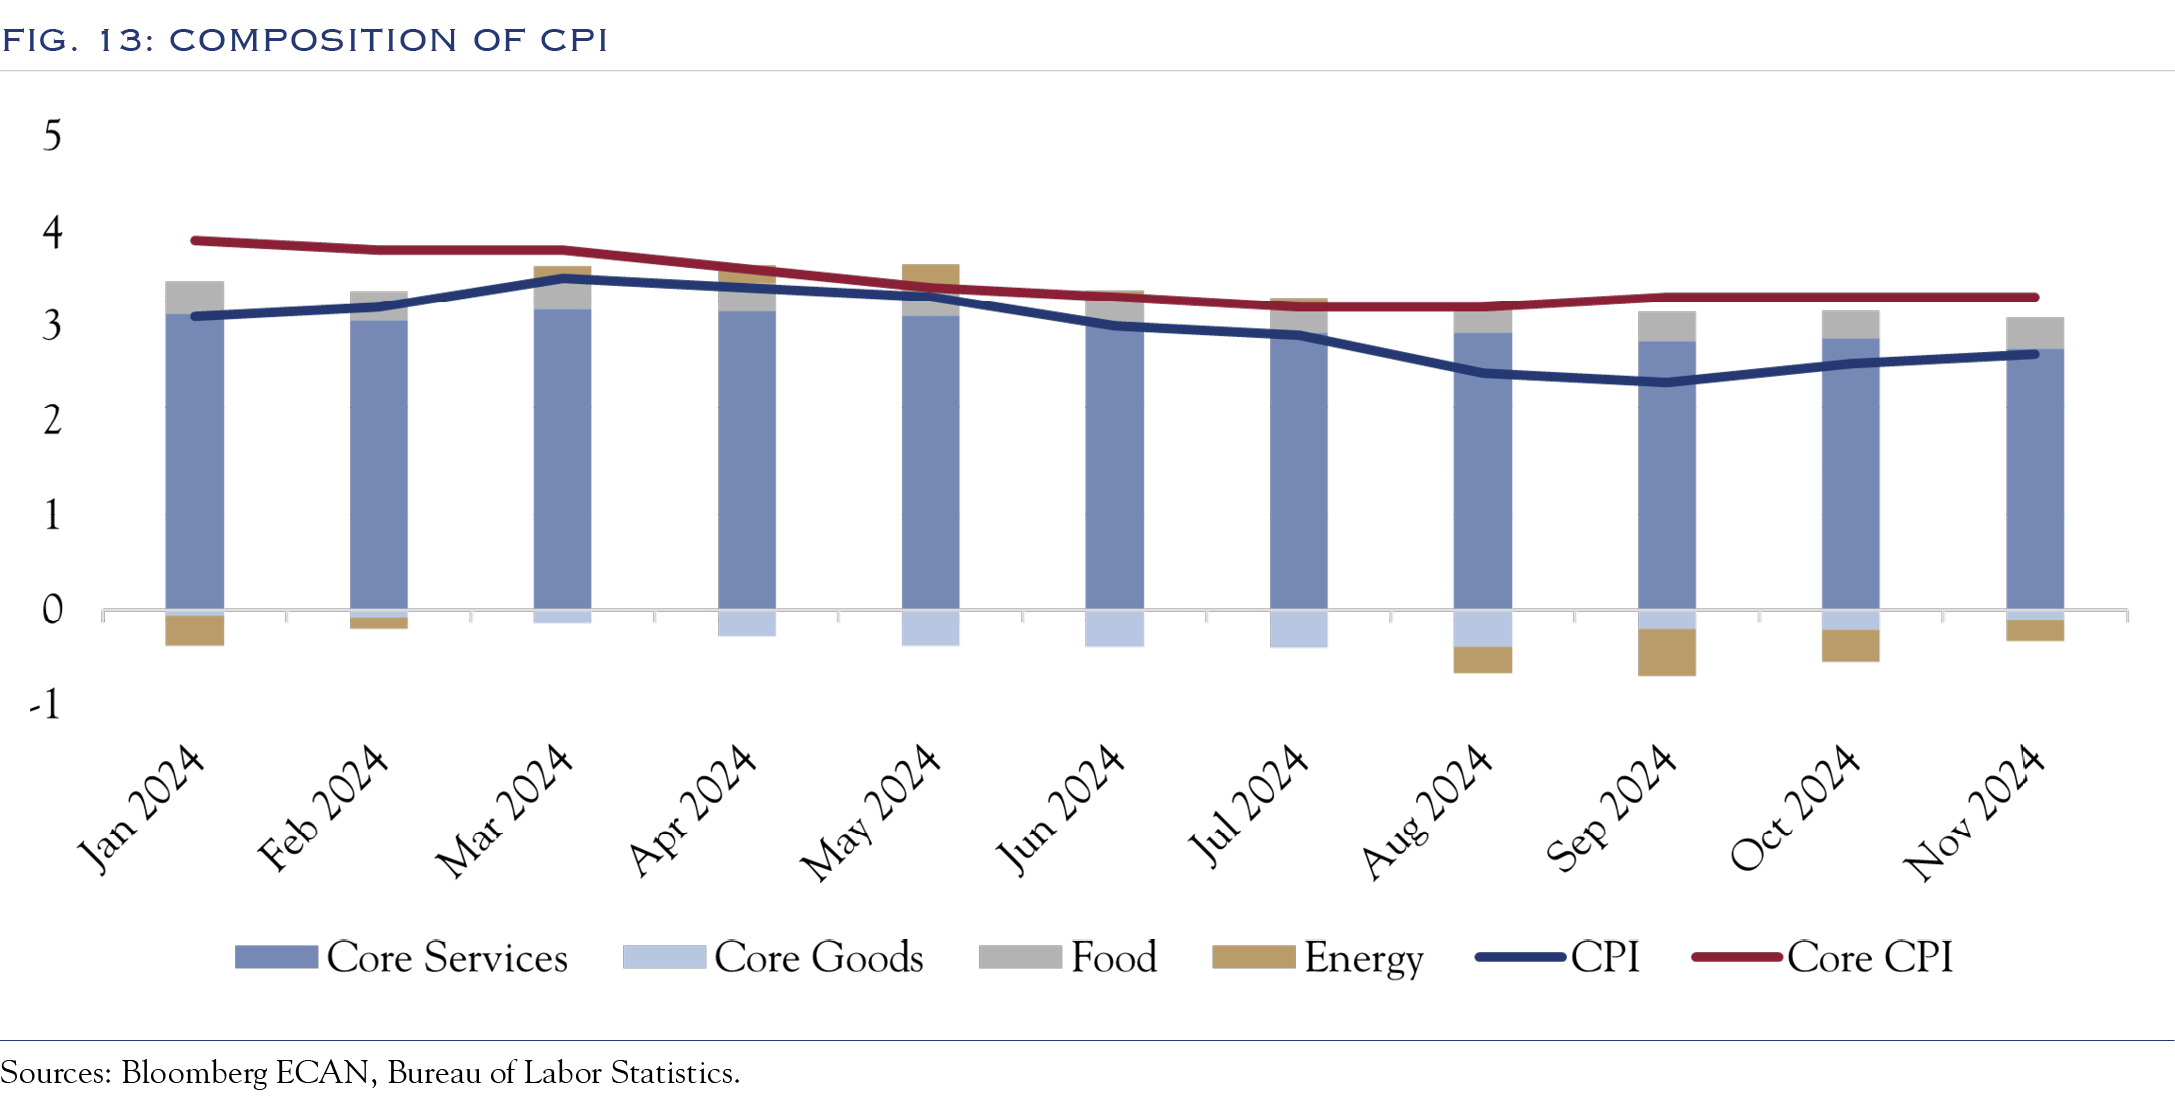
Many other inflation components have normalized. Food inflation is running at 2.4%. Energy has been running at a negative rate. Core Goods is running at –0.6%. The only meaningful inflation has been in Services (typically resulting from substantial wage gains), with Services inflation running at 4.6%. Most components of Services inflation are running above 2%, with some significantly so, though often for quirky reasons.
One of the most significant contributors has been motor vehicle insurance, running at +13% and contributing 0.35% (13% of total CPI). Motor vehicle insurance inflation peaked at nearly 21% year-over-year in January 2024. One contributor to high insurance costs is the pass-through effect of higher values of new and used cars. Those price increases peaked in 2022 and have been trending negatively, which should alleviate some car insurance pricing increases. The cost of car repairs also increased, reflecting higher prices for labor and parts. Price increases for car parts also peaked in mid-2022 and have been around zero in recent months. Labor costs for non-supervisory automotive mechanical and electrical repair workers spiked in mid-2022 and have been relatively stable throughout 2024. We expect auto and auto-related inflation to cool in 2025.
In assessing inflation, the Fed focuses on the Personal Consumption Expenditures Core Index (PCE – Core). This index has similar dynamics to CPI, though with different component weightings. For instance, health care is a more significant component weight in PCE than in CPI. Outside of Housing, Healthcare and Financial Services are both large contributors. Healthcare inflation across a range of categories is generally running around 3–4%, a bit above averages over the past ten years and consistent with post-pandemic trends. Financial Services inflation is running over 7%, with more substantial increases coming from asset-based fees, which have increased as market values have increased. (For more on the similarities and differences between CPI and PCE, check out the article “Monitoring Inflation—Why The Fed Prefers PCE Over CPI” in our Insights publication).
No matter the metric, inflation remains above the Fed’s idealized 2.0% target. Yet many of the dynamics keeping inflation above 2.0% are not necessarily responsive to changes in interest rate policy. This makes for difficult interest rate policy decisions, and we expect the Fed to move slowly and deliberately in a data-dependent manner.
The three most important questions on inflation are:
1. When will inflation return to the Fed’s target rate of 2.0%?
Estimates from the Consensus Economics survey of forecasters show inflation expectations hitting 2.1% in April 2025. Examining the sources of inflation listed above, it appears that much of the inflation fuel, such as shelter and insurance, should begin to subside. While other inflation hot spots may emerge, current trends point toward easing inflation in the months ahead.
2. Will the expected policies of the Trump administration cause a meaningful change in the inflation rate?
The new year brings new leadership in the White House and Congress. There is a complex set of crosscurrents regarding inflation. Immigration policy may lead to higher wages, which could translate to higher services prices. Regulatory change is likely to push inflation lower, with moves towards energy independence and the removal of red tape, easing business activity.
Tariffs could put some upward pressure on prices. The most recent commentary from President-elect Trump has indicated tariffs of 25% on Mexico and Canada and an additional 10% on China. Those figures might get negotiated to lower (or higher) rates. Using those announced possible tariffs, and with imports running around 15% of the U.S. economy and imports from Mexico, Canada, and China at 16%, 12%, and 14%, respectively, a back-of-the-envelope estimate suggests up to 1.2% in price increases is possible.
However, some goods are imported at prices much lower than their ultimate selling price, making the tariff a smaller percentage of the price paid by the end consumer. Further, some substitution may occur and some foreign exporters may choose to lower prices to remain competitive, inclusive of tariffs. We estimate a 40% pass-through rate from tariffs, resulting in up to 0.5% upward price pressure. Still, excluding tariffs, prices are expected to drop about 0.6% in the next eight months.
For comparison, prices rose about 0.7% overall after the first Trump tariffs, but many standard economic factors also contributed to this increase. As is typical with tariffs, the price increases occur on a one-time basis and then normalize at a higher level. In 2018, this price burst lasted about nine months.
We have a somewhat out-of-consensus view and expect that the policy mix and tariffs may not be as inflationary as many forecasters currently estimate.
3. Is there a substantial difference between economic growth and interest rate policy if rates are at target vs. 0.5% above target?
The Fed establishes policy to fulfill a dual mandate of full employment and stable prices. It is generally thought that if push comes to shove, the employment side of the mandate will take precedence. That is especially true when inflation is entirely under control, or at least within the target range as it is today. Thus, the difference between inflation of 2.0% and 2.5% is a significant issue for now but would become a non-event if employment weakened. We expect the employment situation to remain stable and thus expect the Fed to focus on inflation returning to target. For this reason, changes in rate policy are likely to be slow unless employment weakens.
In 2025, inflation will average around 2.5% as ongoing declines will be partially offset by one-time inflation impulses from tariffs. Over our three-year horizon, inflation will continue to fall and ultimately reside at 2.0%.
Deficit & Debt
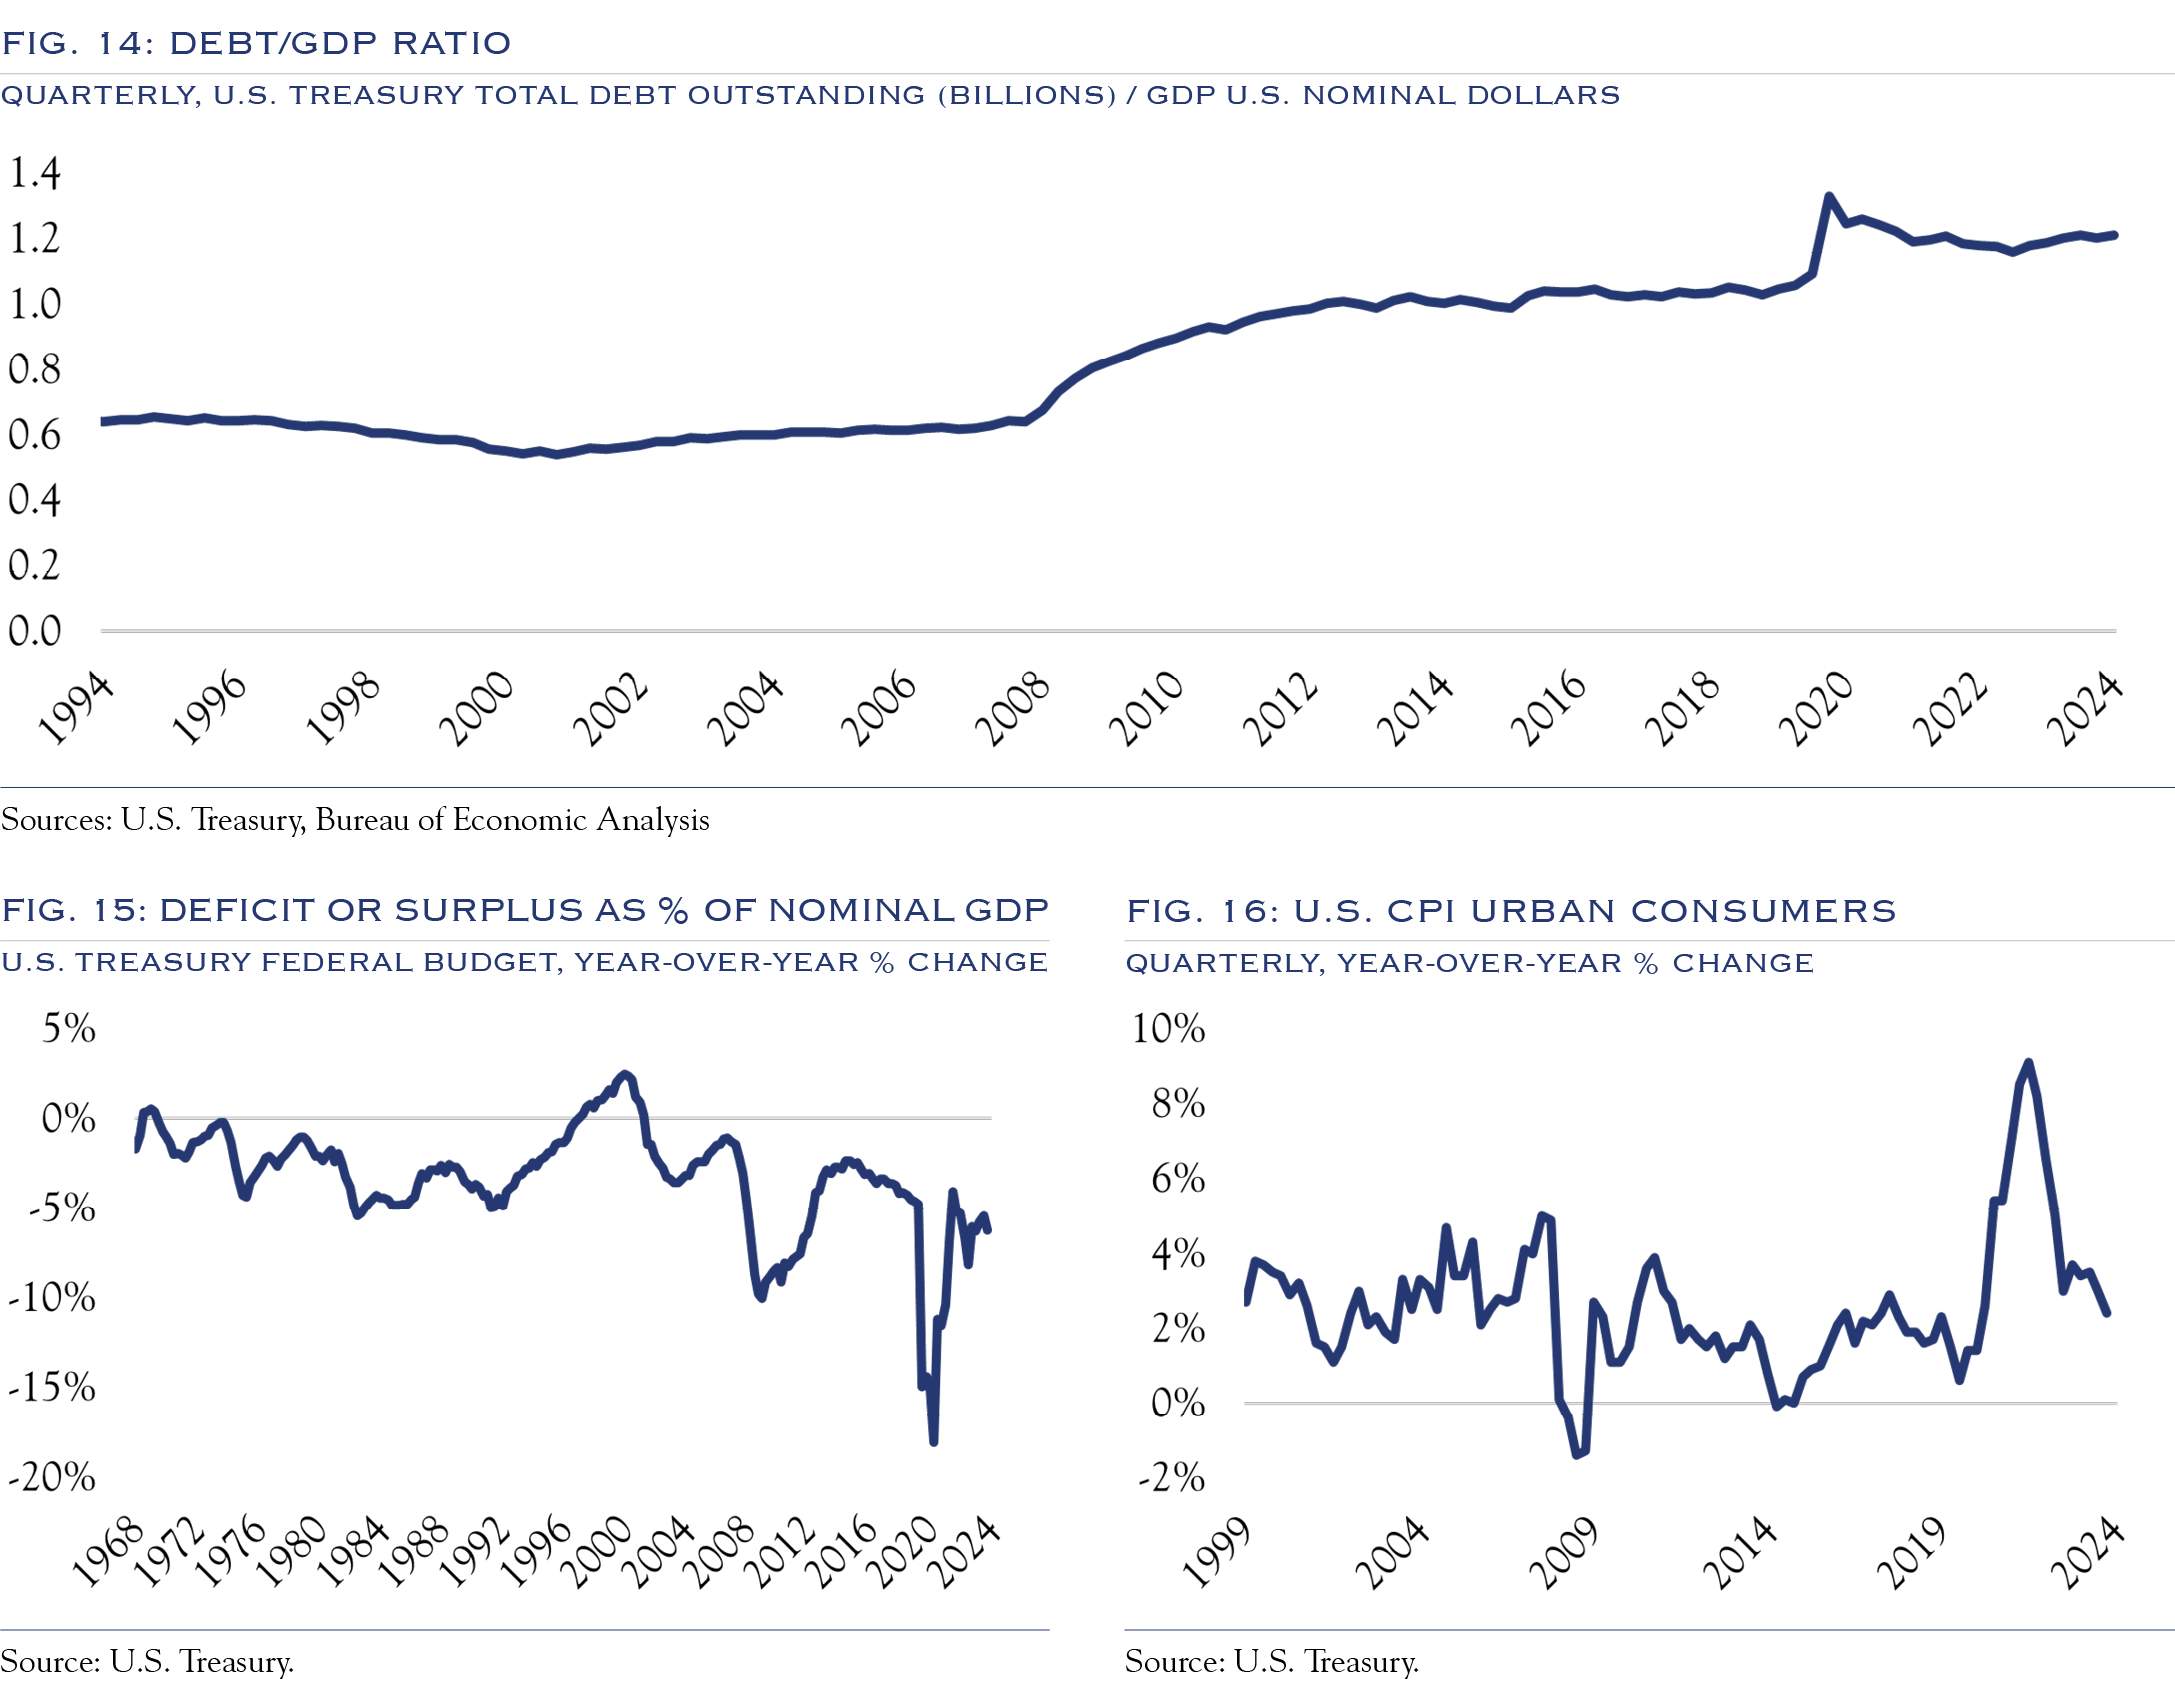
Presently, the deficit is around 5–7% of GDP annually. Figure 15 shows that the deficit commonly ranged from 0–5% of GDP outside of recessionary periods. Policy choices during the 2008 financial crisis and the pandemic caused significantly larger deficits during those periods, piling on even more debt.
The deficit will continue to add to the debt problem regardless of changes in tax policy and spending.
Since budget surpluses are exceedingly rare and were last seen over 20 years ago, the total level of outstanding U.S. debt continues to grow. While GDP has also grown, the debt level is growing faster than GDP, with the ratio of debt/GDP growing from well under 1x before the financial crisis to 1.2x currently, as shown in Figure 14.
Data from the Peterson Foundation show that two-thirds of U.S. debt is held domestically, with the Federal Reserve as the largest holder and mutual funds and banks as the next two largest, followed by state and local governments, pension funds, and insurance companies. Each of these entities has structural reasons for holding Treasuries and will likely remain willing buyers. Foreign holders comprise Japan, China, and the U.K. However, the nationality of the ultimate owner of Treasuries is often unclear, as is the case when holdings are in tax jurisdictions such as the Cayman Islands. For foreign holders, interest rate differentials usually play a prominent role in determining whether U.S. Treasures are compelling, and foreign demand can change over time. However, current yields, economic growth estimates, demographics, and other factors make the U.S. a desirable destination for bond buyers.
Treasury Secretary nominee Scott Bessent has indicated a desire to cut the budget deficit to a smaller percentage of GDP and is seen as open to extending the maturities on issuance. The tradeoff here is the debt service predictability of longer-term bonds vs. the strong investor demand for short-term bonds, which are generally easier to hold on balance sheets. Given Bessent’s ties to financial market participants, we expect close attention will be paid to market reactions to issuance decisions. This market sensitivity should help navigate the challenging process of high levels of debt issuance in the coming years.
The best way out of the twin evils of deficit and debt is to reform spending and increase economic growth. Bessent has indicated an intention to focus on these issues. The level of GDP growth has a significant effect on debt ratios. A slight difference, for better or worse, in economic growth will create substantial differences in projections. Productivity, demographics, and economic growth matter much to future debt/GDP ratios and will be critical indicators for determining when the U.S. debt becomes a strong headwind. Estimates from the Congressional Budget Office show that a 0.5% increase in productivity could be enough to keep debt/GDP levels in check.
If deficit and debt issues become a problem (i.e., when the new bond vigilantes show up), some kick-the-can solution will likely emerge. There are several steps both the Fed and Congress could take to delay the inevitable. For example, Congress could form a bipartisan committee to reform social security or other entitlement programs. The Fed could act to support the Treasury market, helping to contain interest rates. While some of these changes from Congress might be more theoretical in accounting for estimated changes to deficit levels in the future, they would demonstrate some effort toward solving the problem. Similarly, action from the Fed to support the Treasury market would be deemed a “band-aid”, yet investors have long realized that it doesn’t make sense to fight the Fed, given the depth of their power in markets.
Despite the enormous debt and issuance levels, the Treasury market’s stress and liquidity metrics continue to track to normal levels. In September 2024, the New York Fed issued research on the Treasury market, noting that:
“Standard metrics point to an improvement in Treasury market liquidity in 2024 to levels last seen before the start of the current monetary policy tightening cycle. Volatility has also trended down, consistent with the improved liquidity. While at least one market functioning metric has worsened in recent months, that measure is an indirect gauge of market liquidity and suggests a level of current functioning that is far better than at the peak seen during the global financial crisis (GFC).”
Has Treasury Market Liquidity Improved in 2024? —Liberty Street Economics
If conditions become choppy for Treasury issuance, the administration can send a powerful signal by beginning to tackle the spending side of the budget. Even if these moves are more optics than reality, history has shown that debt problems can persist for extended periods of time. Investors are unwise to assume they can predict the tipping point for problems with interest rates.
The deficit/debt problem remains manageable and not an imminent concern. Over the next three years, we do not anticipate problems in interest rates stemming from financing the U.S. debt or inflation concerns.
Rates Outlook
In 2016 the Fed attempted to raise rates from near zero. On the way to Fed Funds reaching 2.5% in 2019, markets rebelled in late 2018. Following the market meltdown, the Fed quickly reversed course, lowering rates and then cutting rates aggressively when the pandemic struck.
Absent major issues with inflation or the deficit, rates will trend lower, with Fed Funds heading towards 3.0% and the 10-Year Note heading towards 3.5%.
The level of real rates deemed to be neutral, called r*, is unknown and ever-changing, yet it is generally accepted to be around 1.0–2.0%. If inflation reaches the Fed’s target of 2.0%, rates should end up around 3.0–4.0%. However, lower inflation or weaker economic growth could lead to a lower neutral rate. With the Fed Funds target rate currently at 4.50– 4.75%, rates will have room to come down, assuming inflation leads the way.
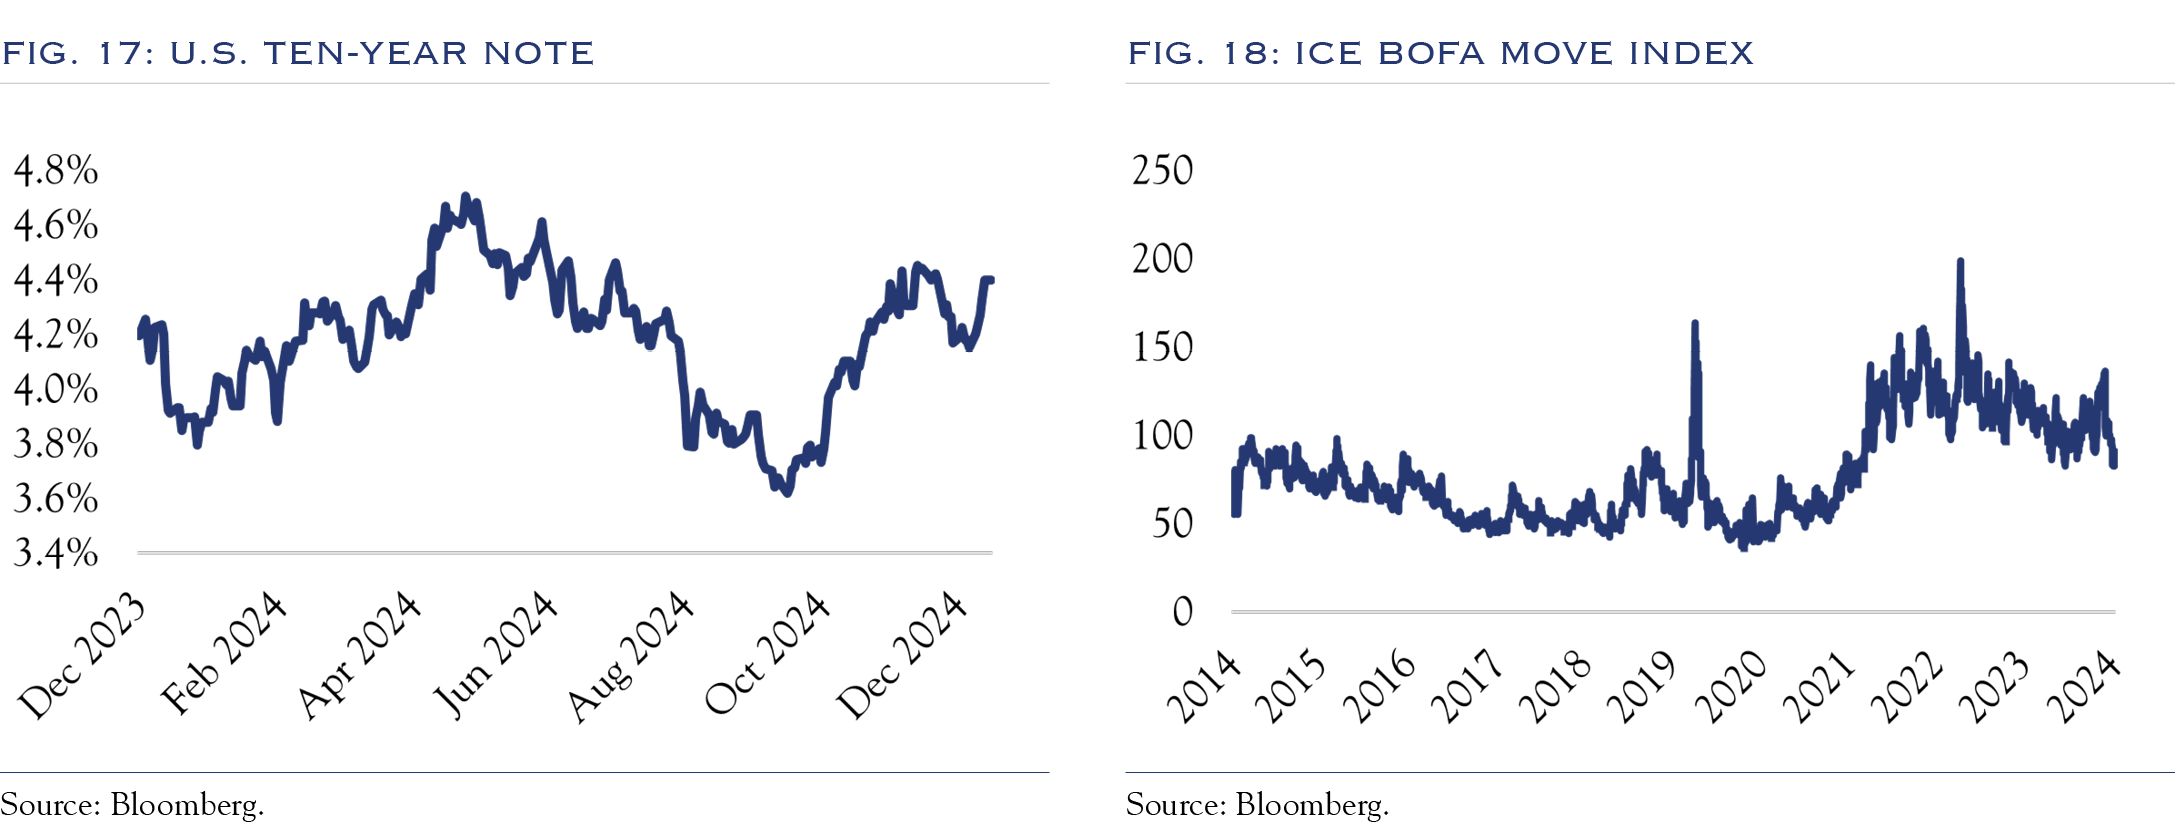
The low point for yields on the U.S. Ten Year Note for calendar year 2024 was 3.62% in mid-September, at which point they reversed course and headed to 4.45% in early November.
We see yield pricing keyed to the probability of a smooth return to “normal” Fed Funds Rates of around 3.00–3.50%. Those probabilities will be assessed through the path of inflation, the influence of “bond vigilantes,” and the supply-demand dynamic of issuance management.
At times, it has appeared that the return to normal would be a high-probability event, and yields have pushed towards 3.5%. At other times, the path ahead seems a bit more treacherous, and yields have pushed above 4.0% up to 4.5%. This range has been volatile, as shown in the MOVE Index (Figure 18).
Using expectations derived from futures markets, investors expect Fed Funds to end 2025 at 3.8%, with three additional rate cuts of 25 basis points each.
If there is a surprise, we expect the economy and inflation to be weaker than expected and the Fed to move faster than currently projected. We think it is less likely that growth and inflation will accelerate in a manner that leads to rate increases.
Our base case is that inflation will trend lower very slowly, and Fed policy will evolve similarly. Rates will then follow the Fed.
Yields on the U.S. Ten Year note will remain mostly rangebound in 2025 as we continue to re-calibrate expectations of Fed policy. Over the next three years, we see a neutral rate policy of around 1.0%, with inflation of 2.0%, and expect Fed Funds rates to return to 3.0% (or lower if the job market weakens).
Equities
Valuations are elevated vs. historical norms. Over the next three years, equities will gradually grow into their valuations.

Valuation
Our valuation model uses five primary inputs: inflation, interest rates, sentiment, domestic policy, and the geopolitical backdrop. For each, we evaluate current conditions and assess the path forward relative to historical norms.
Inflation
Inflation levels are okay and trending better. Inflation has descended from problematic levels, and while not yet at the Fed’s target of 2.0%, it has ceased to be a problem for valuations. We expect this factor to gradually improve but anticipate no further pass-through to higher valuations.
Rates
The rates backdrop is good and trending better. We expect rates to move to lower levels slowly but not approach all-time lows. Valuations are consistent with rates at or below current levels, so we expect no further benefit to valuation metrics from declining rates.
Sentiment
Sentiment readings are near maximum positive levels and could contract from here. Nearly every sentiment indicator is in strongly positive territory. The AAII “bullish” reading, the NAIIM Exposure Index, the NFIB Small Business Optimism Index, PE ratios vs. history, and even non-traditional measures of enthusiasm such as the recent $6.2 million auction sale price of “Comedian,” the duct-taped banana, all point to a very favorable sentiment backdrop. Historically, strongly positive sentiment is more consistent with the later phases of equity rallies. We expect this factor to remain stable, with no further improvement.
Domestic policy
The domestic policy backdrop will likely trend in a favorable direction, though expectations are running ahead of reality. Investors assume the domestic policy backdrop will bring favorable tax and regulatory policy news. While tax and regulatory changes will likely be additive to the business backdrop, at least some of this news is already embedded in valuations, while the details remain unknown.
Geopolitics
The geopolitical backdrop is slightly negative and trending toward stable/neutral. While challenging conditions remain in the Middle East and with Russia, the situation has mostly stabilized. We expect this factor to improve slightly if conditions remain stable. Note that “noisy news” is likely to be part of the process for the Trump administration. However, we expect actual conditions to be more stable under the “peace through strength” doctrine.
Our valuation model scores each element above based on current conditions and our expectations for conditions over the next three years. These scores are then used relative to historical conditions to estimate a current “fair value” PE ratio and an estimate for PE ratios three years hence.
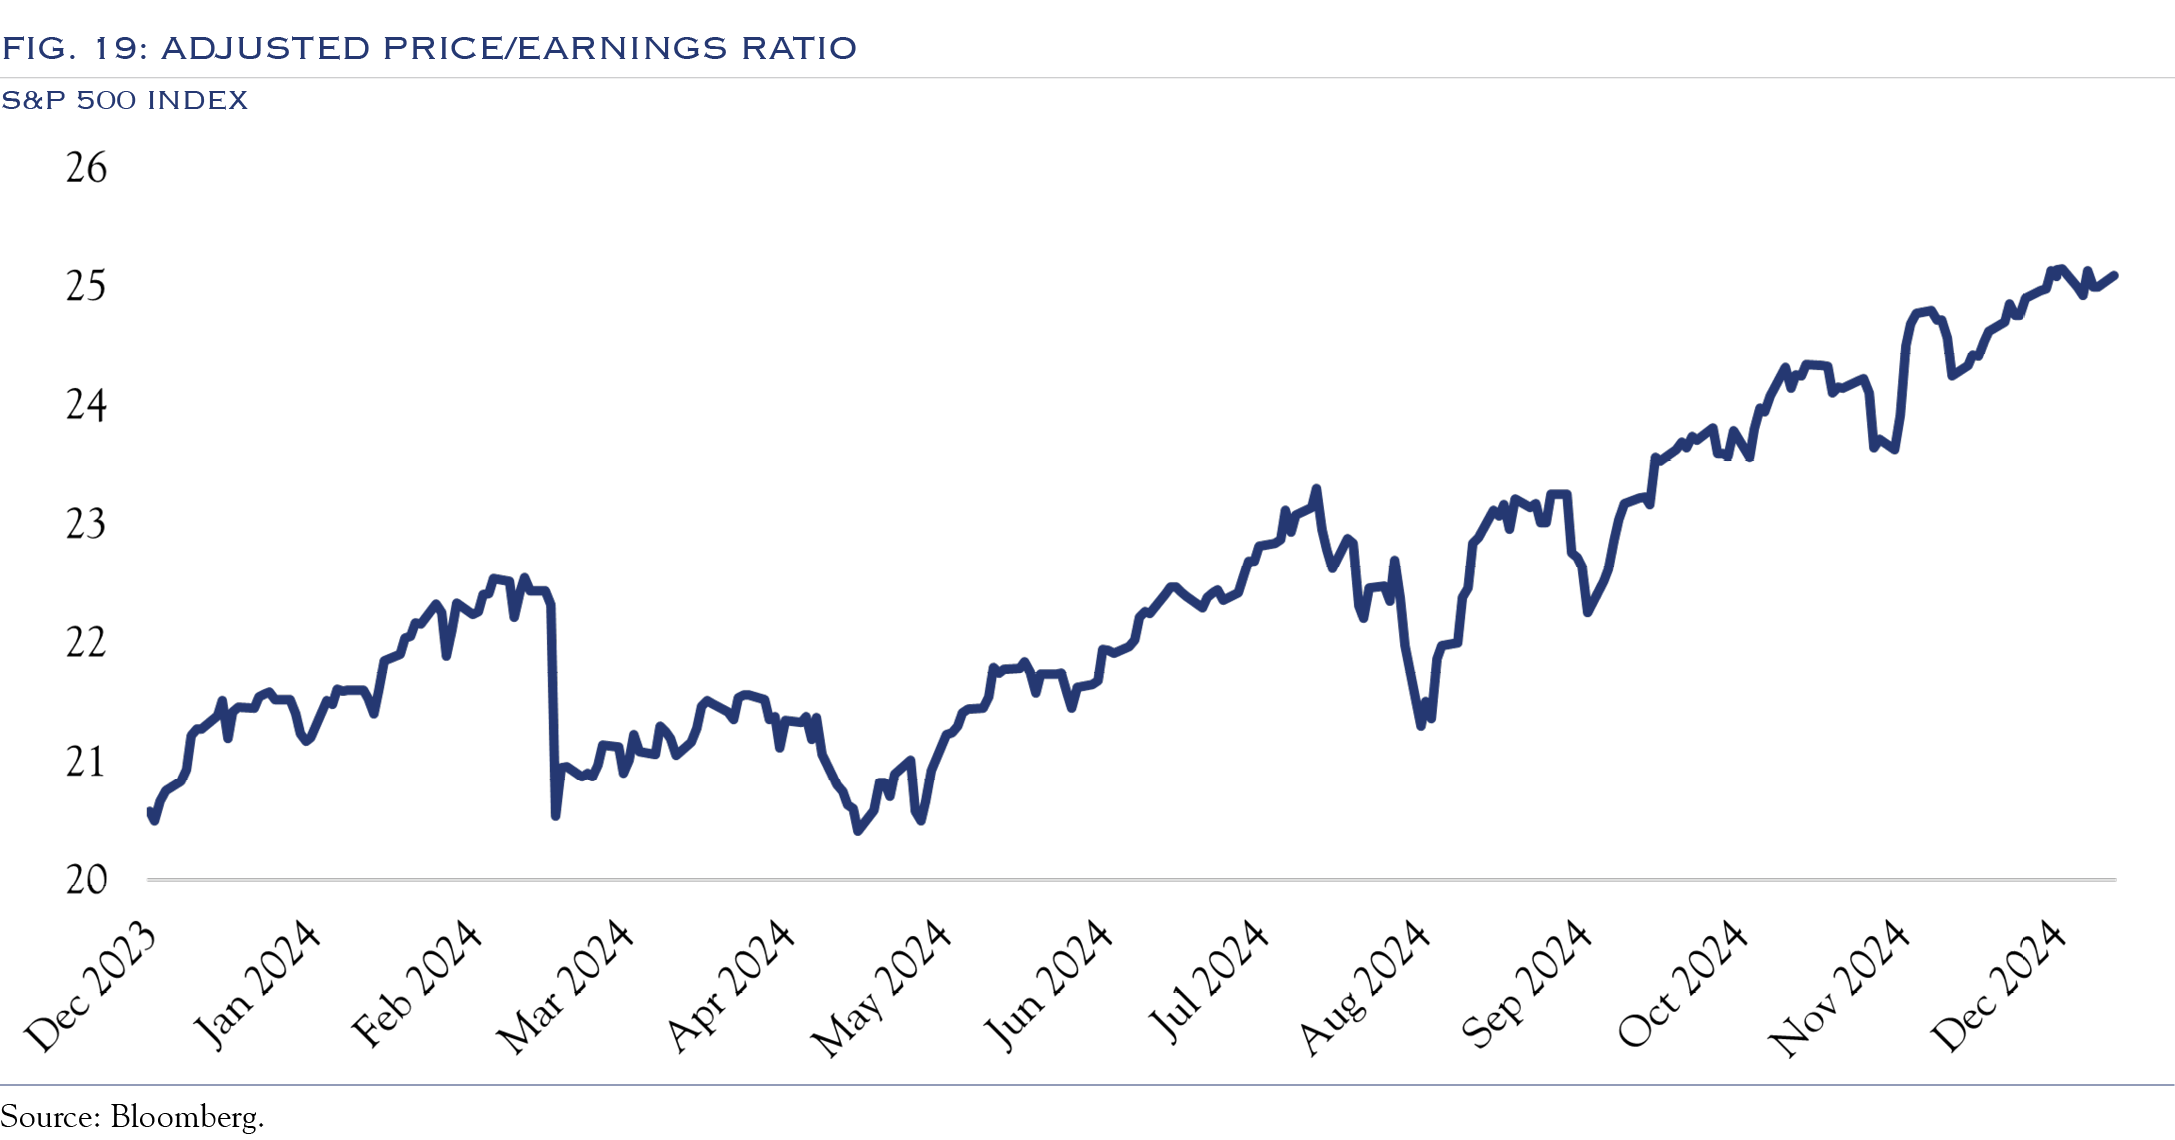
Valuation metrics are elevated, with both current and forward PE ratios for the S&P 500 sitting near the top decile vs. history. Figure 19 shows the rising PE ratio for the S&P 500 in 2024. In many ways, current conditions, as outlined in our valuation model, support those valuations.
One example is the relationship with interest rates. Unless rates are above 5.0%, valuations can reside in the 20–25 range for long periods. Across 37 quarters where PEs were in a range of 20–25, interest rates averaged 4.5%. The late 1990s saw elevated valuations and rates that ranged from 4.5% to nearly 7.0%. Today’s yield on the U.S. Ten Year Note of 4.25% is compatible with PEs in the low 20s.
With valuations already elevated and most factors that influence valuation already in favorable configurations, it seems unlikely that PE ratios will head much higher. This means that future gains must come primarily from earnings.
The problem with valuations is that things are so good that they can’t get much better.
In 2025, high valuations will govern returns and lead to some volatility. Over the next three years, stocks will “grow into” current valuations via a stable macro backdrop for the factors and continued modest earnings gains, working to bring valuations back towards normal levels.
Earnings
Current consensus estimates are for +2.1% real GDP growth in 2025 and 2.0% in 2026. These figures are in line with what we believe to be the long-term trend rate of growth in the United States of 2.0%. We share the consensus view of a slowdown in economic growth, though our research shows that anything above 1.5% GDP growth is “good enough” for earnings growth.
The level of economic growth and the change in profit margins are essential elements of the earnings outlook.
Our GDP growth estimate is derived from expectations of population trends that will produce a slight increase in the population and modest productivity gains. It is possible that productivity advances at a faster clip, and GDP growth could push towards 2.5%.
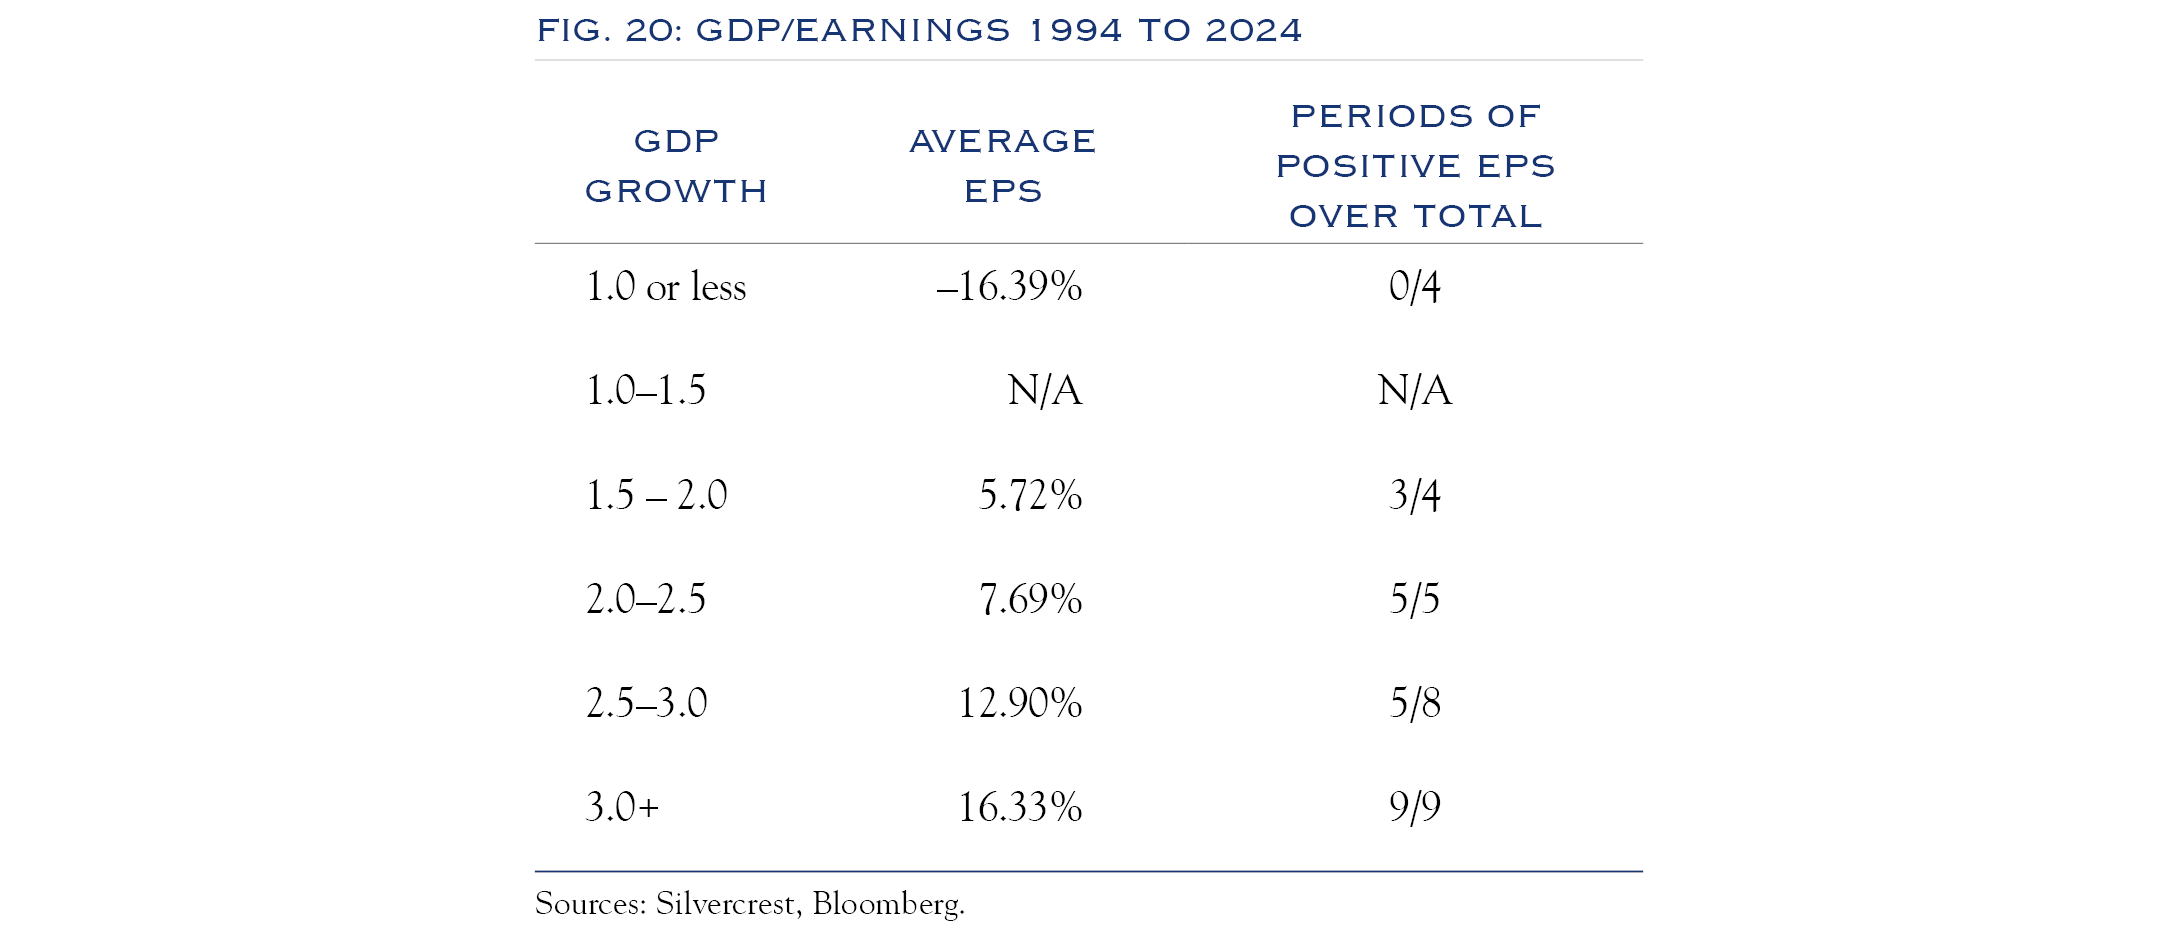
Historically, if growth hits 2.5% or higher, this has led to earnings gains well above 10%. If growth dips below 1.5%, earnings gains generally evaporate as companies prepare for a possible recession.
For context, over the past 30 years, GDP growth averaged 2.6%, and earnings gains averaged about 7.5% annually. Over the next three years, we expect GDP to expand at a rate of +2.0–2.5%, around our estimate of the long-term normalized run rate of 2.0%. We look for continued adoption of technology to enhance productivity and profit margins. Our research shows that a modest utilization of AI can enable mid-single-digit revenue gains without commensurate labor cost increases. (To see more of our model, please read our article, “The Three Waves of AI Adoption & The Impact of Technological Innovation on Productivity,” from our recent edition of Insights.)
We estimate earnings gains for the S&P 500 of 9% in 2025 (below the consensus estimate of 14%). Over the next three years, a decent growth backdrop in conjunction with continued expansion of profit margins will bring earnings gains of 7.0% annually.
Equity Outlook
Over the past 30 years, the price return on the S&P 500 has been 9% annualized, with about 7.5% coming from earnings gains and 1.5% from valuation expansion. Over that period, the PE ratio averaged 19x, with a high of 29x in 1999. With PE ratios currently around 24x, it is unreasonable to expect any further valuation expansion.
Stock gains will need to come from earnings as valuations are elevated.
In 2024, earnings contributed 30% of the calendar year gain vs. the historical average of 65%. In our forward-looking view, we expect long-term historical trends to dominate, with earnings being the key driver of equity price appreciation.
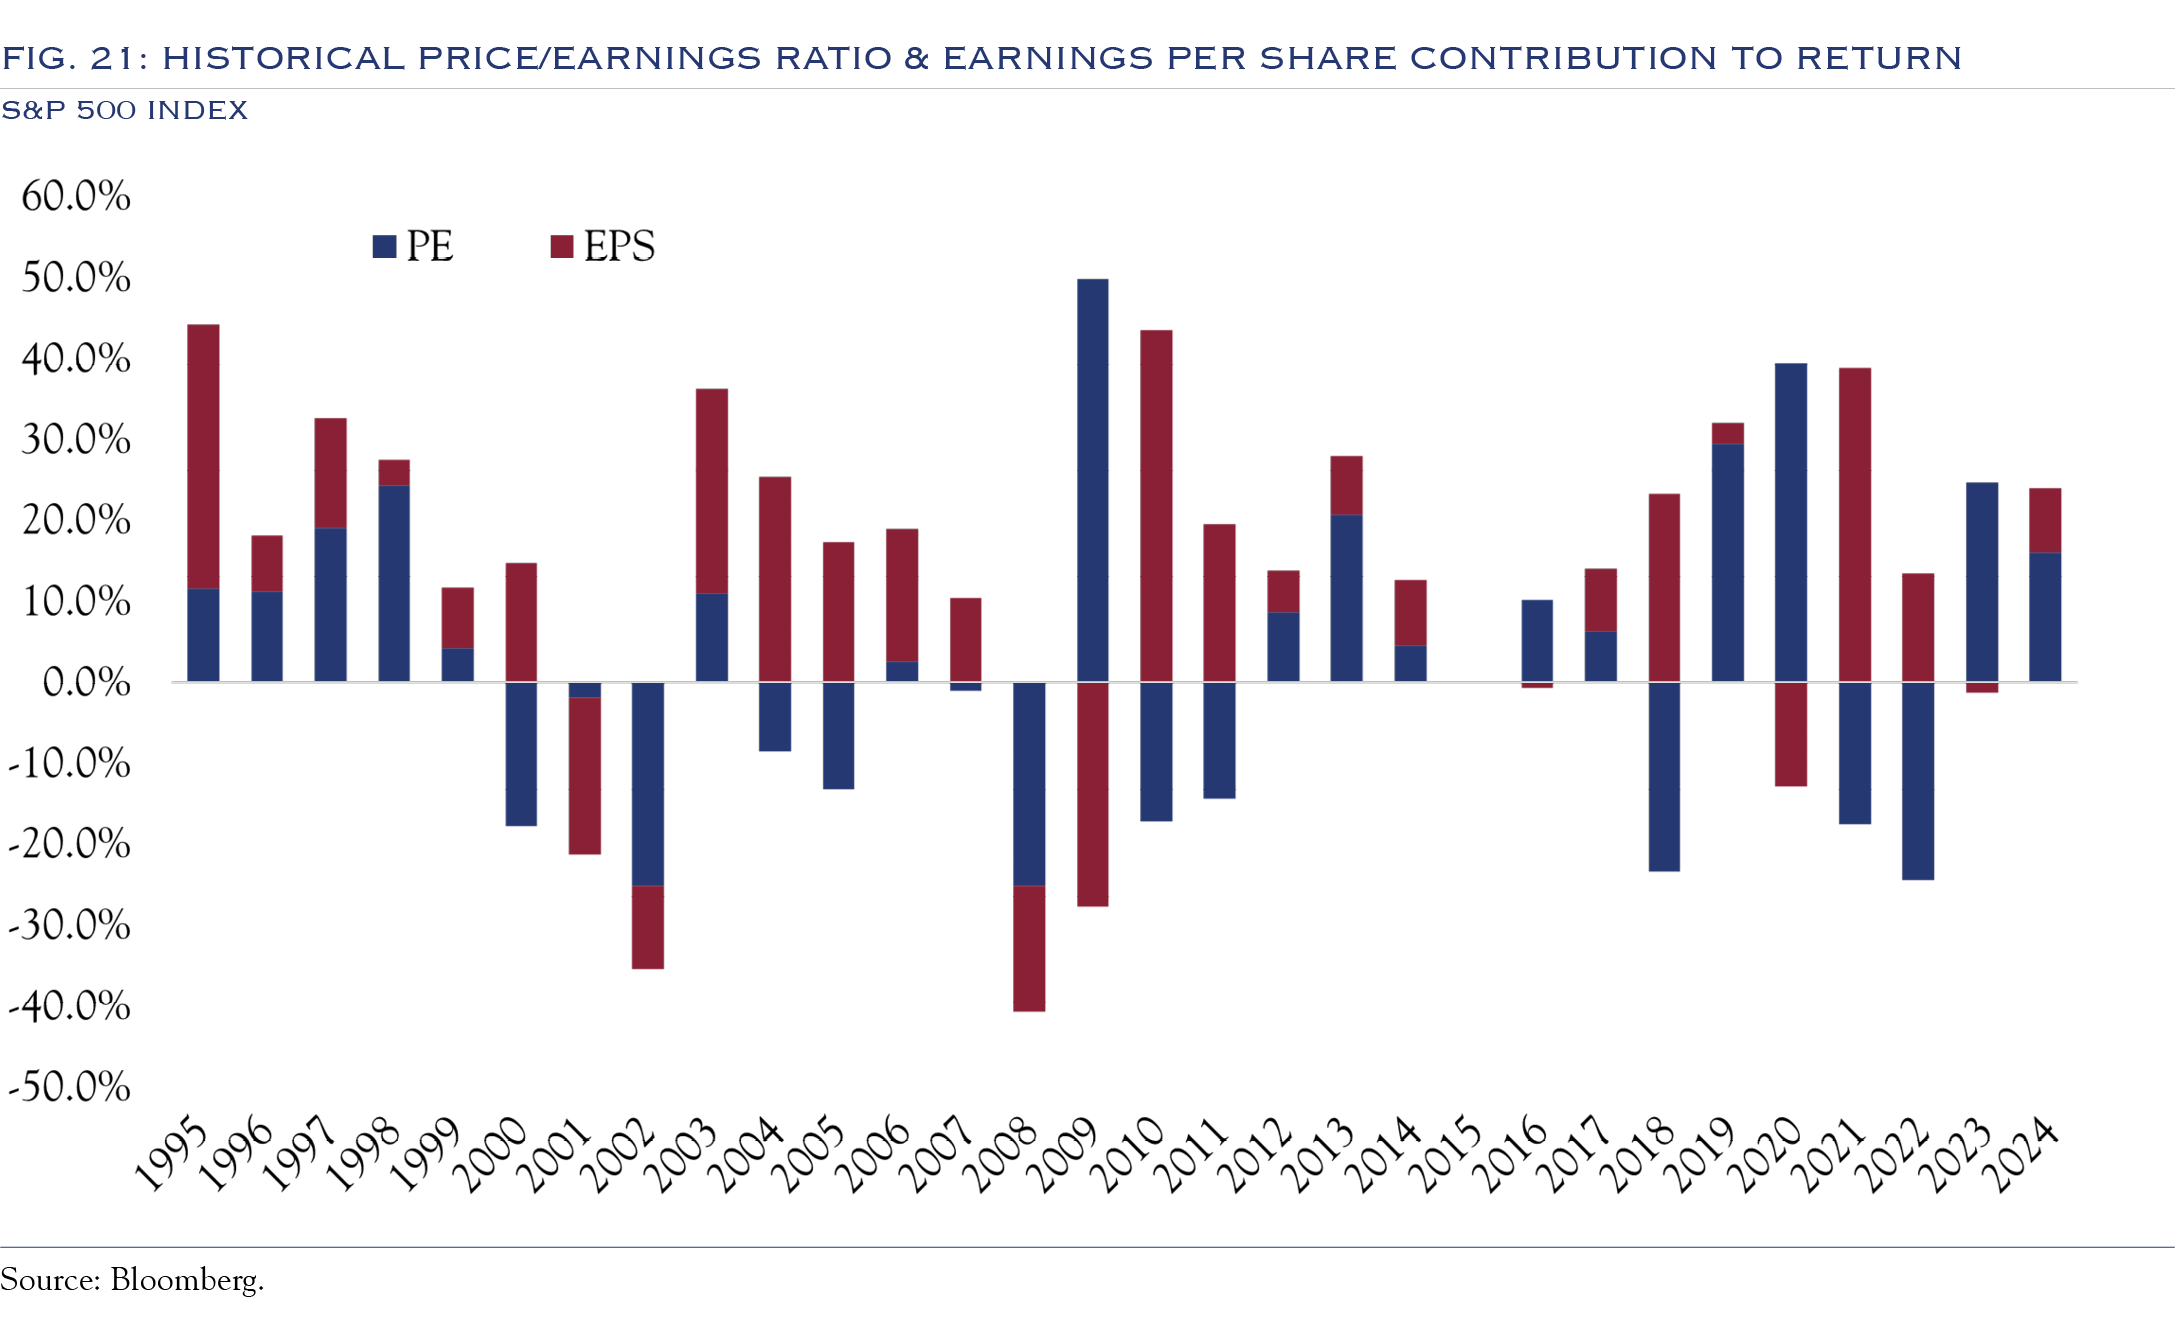
In 2025, we expect a 9% advance in U.S. equities as stocks track earnings higher. Over the next three years, we expect equity returns of 7.5%, with 7.0% coming from earnings, 1.5% from dividends, and a slight drag from multiple compression.
Asset Allocation Guidance

Our three-year forward-looking asset allocation guidance derives from our views on the economy, earnings, rates, and valuations. Asset allocation has been a diabolical challenge in recent years, as only a very narrow segment of categories has delivered performance above the indices, making diversification a penalty. Looking ahead, we expect the backdrop to improve. The starting yield in fixed income offers a solid building block for portfolio construction. If interest rates stabilize or trend lower, fixed income will provide a nice return and diversification. We also expect a more significant segment of equities to see earnings gains. The disruption of the pandemic and the potential of AI created massive opportunities for dispersion, and the initial winners were mostly larger, tech-oriented companies. With the M&A environment picking up, financing costs becoming more bearable, and productivity gains spreading, we expect to see more companies generating earnings growth, leading to broad-based gains. The “penalty” of diversification is likely to dissipate, and the opportunity set for asset allocation will expand.
Style

We recommend a balanced allocation to both growth and value-oriented investments, as there are compelling opportunities for stock pickers in both style buckets. We expect significant dispersion that transcends growth/value and is determined by individual company management team efforts to boost productivity and profit margins. Stock selection will be more important than style selection.
Market Cap

We see a three-part catalyst for a broadening of the market to small caps. First, likely changes in regulatory policy will spur M&A activity. Traditionally, smaller companies benefit as the target of M&A. Second, the continued (albeit slow) easing of interest rate stress will accrue to the benefit of small caps. This playbook has unfolded several times—any drop in rates is met by a rally in small caps. Third, the cost of access to productivity-enhancing technologies will spread to smaller companies, putting them on more even ground in seeking profit margins. This will help to narrow the earnings gap between large and small companies. We continue to recommend an allocation to small caps that is modestly above benchmark/policy targets.
U.S. & Non-U.S.

While many great companies based outside the U.S. have compelling valuations, we remain cautious about the global growth outlook. Continued geopolitical conflict, changes in political leadership, regulatory burdens, and less compelling demographics in China and Europe present macro headwinds. However, numerous excellent companies (many with compelling valuations) are domiciled on exchanges outside the U.S. While the portfolio diversification benefits of globally diversified investing have waned, they do still exist. Over the past ten years, the correlation between the MSCI ACWI Ex-U.S. Index and the MSCI U.S. Index has been 0.46. For U.S. investors, we see non-U.S. investing as an alpha opportunity more than a beta opportunity. We continue to advocate for modest exposure to non-U.S. equities through active management. For global investors, we recommend market weights across geographies for beta management but seek a high active share, allowing the pursuit of excellent companies. For all investors, non-U.S. investing is a rich alpha opportunity set, though, for benchmark-aware investors, careful attention must be paid to geographic allocations.
Fixed Income

We expect a slow path to lower rates, as inflation will be slow to decline and employment has remained stable. We expect some volatility for bonds, with rates trading in a wide range. The Fed and markets will be heavily data-dependent, and markets are apt to overreact to each data point. If employment weakens, the Fed will respond quickly. Overall, this is a good scenario as rate pressure will eventually be alleviated, with the economy still on solid ground.
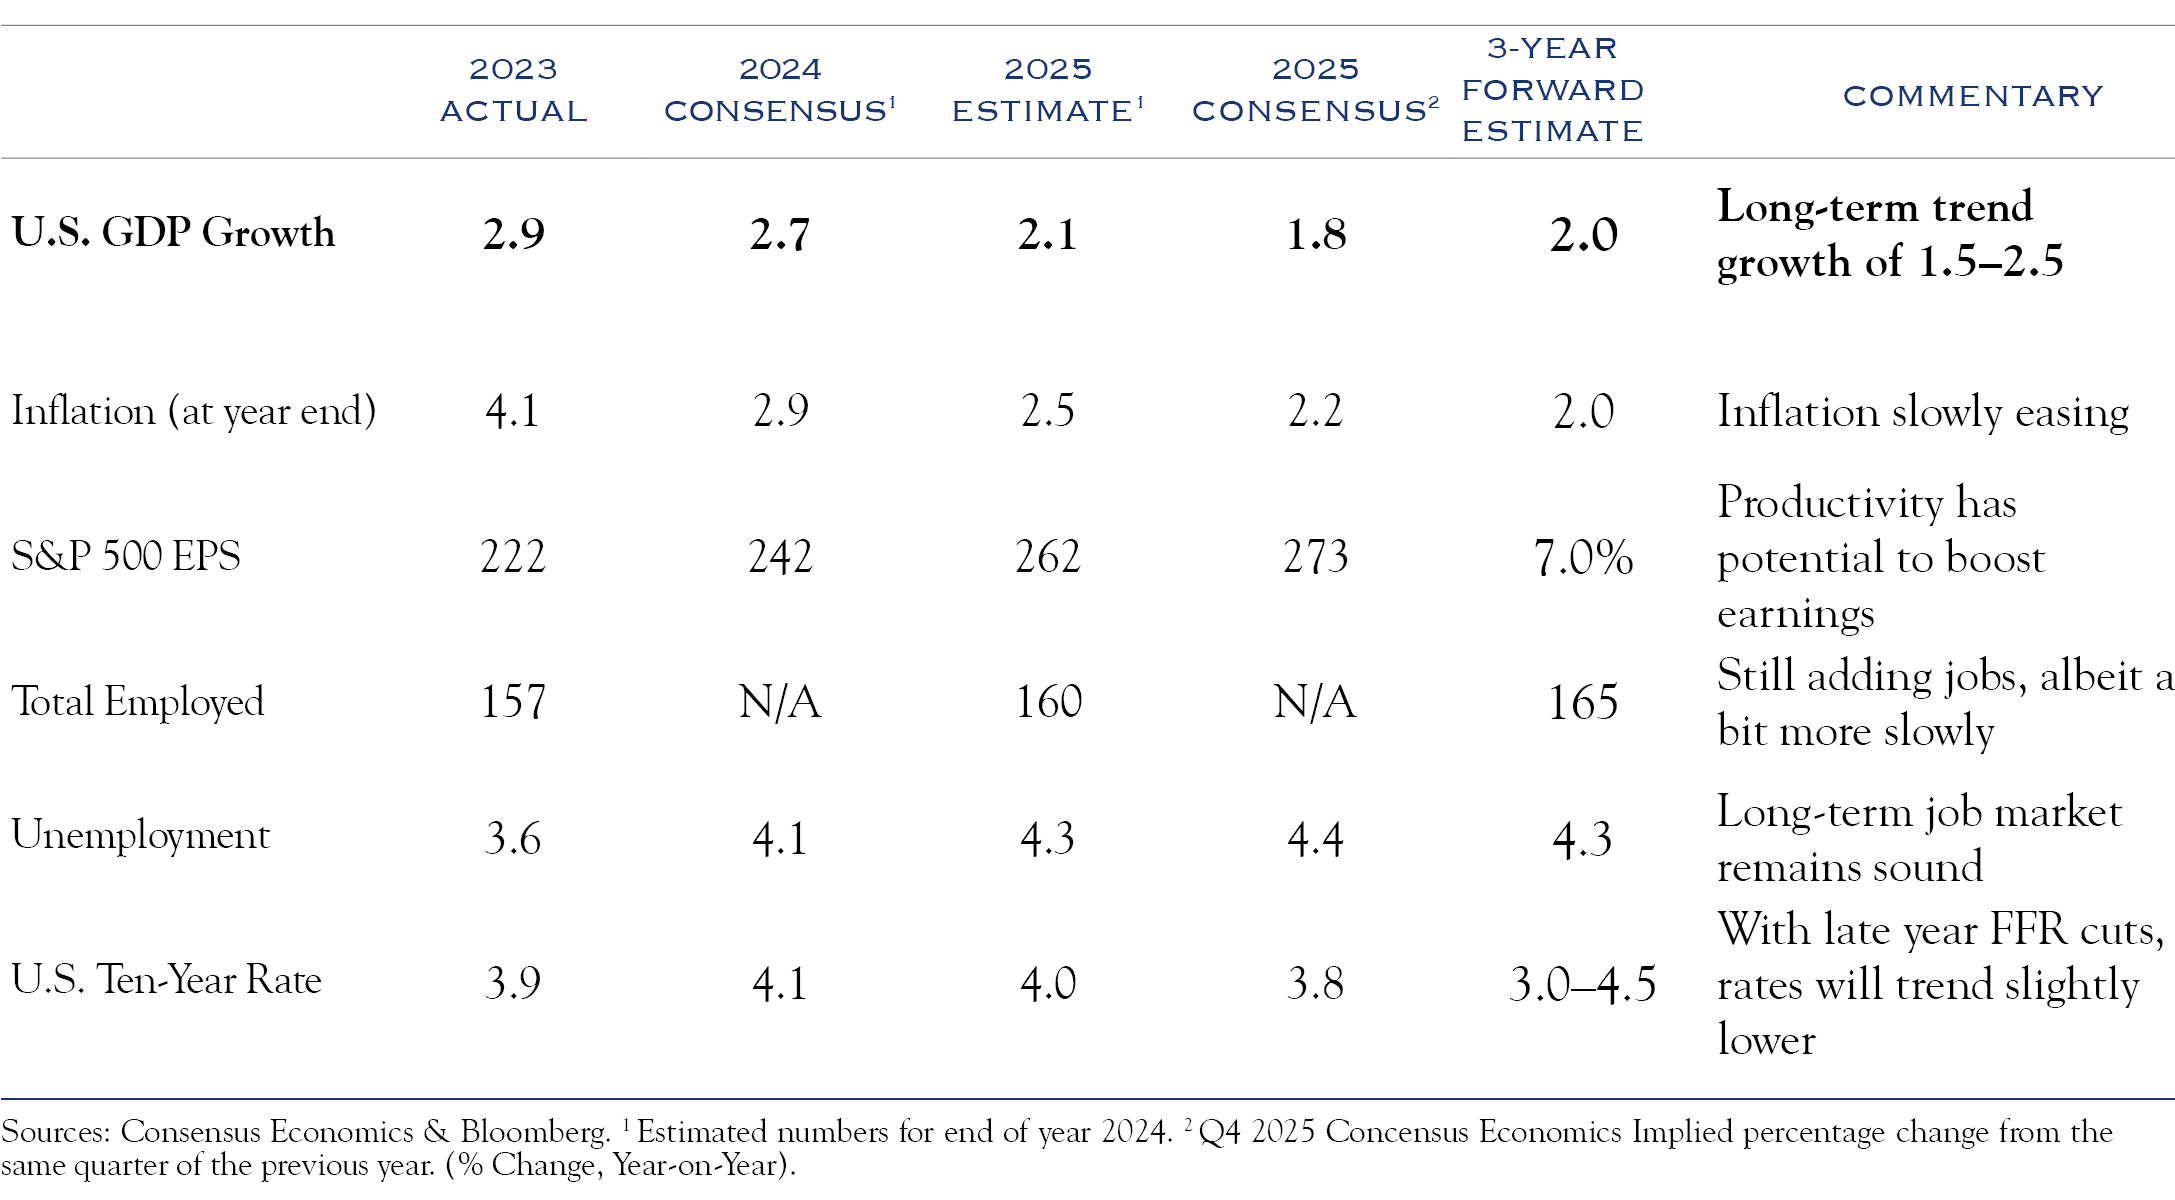
Outlook Table
Disclosures
This document has been prepared without consideration of the investment needs, objectives or financial circumstances of any investor. Before making an investment decision, investors need to consider, with or without the assistance of an investment advisor, whether the investments and strategies described or provided by Silvercrest, are appropriate, in light of their particular investment needs, objectives and financial circumstances. Furthermore, this document is for information/discussion purposes only and does not and is not intended to constitute an offer, recommendation or solicitation to conclude a transaction or the basis for any contract to purchase or sell any security, or other instrument, or for Silvercrest to enter into or arrange any type of transaction as a consequence of any information contained herein and should not be treated as giving investment advice.
This communication was not intended or written to be used, and cannot be relied upon, by any taxpayer for the purposes of avoiding any U.S. federal tax penalties. The recipient of this communication should seek advice from an independent tax advisor regarding any tax matters addressed herein based on its particular circumstances. Investments with Silvercrest are not guaranteed. Although information in this document has been obtained from sources believed to be reliable, we do not guarantee its accuracy, completeness or fairness, and it should not be relied upon as such. All opinions and estimates herein, including forecast returns, reflect our judgment on the date of this report, are subject to change without notice and involve a number of assumptions which may not prove valid.
Investments are subject to various risks, including market fluctuations, regulatory changes, counterparty risk, possible delays in repayment and loss of income and principal invested. The value of investments can fall as well as rise and you may not recover the amount originally invested at any point in time. Furthermore, substantial fluctuations of the value of the investment are possible even over short periods of time. Further, investment in international markets can be affected by a host of factors, including political or social conditions, diplomatic relations, limitations or removal of funds or assets or imposition of (or change in) exchange control or tax regulations in such markets. Additionally, investments denominated in an alternative currency will be subject to currency risk, changes in exchange rates which may have an adverse effect on the value, price or income of the investment. This document does not identify all the risks (direct and indirect) or other considerations which might be material to you when entering into a transaction. For certain investments, the terms will be exclusively subject to the detailed provisions, including risk considerations, contained in the Offering Documents. Review carefully before investing.
This publication contains forward looking statements. Forward looking statements include, but are not limited to assumptions, estimates, projections, opinions, models and hypothetical performance analysis. The forward-looking statements expressed constitute the author’s judgment as of the date of this material. Forward looking statements involve significant elements of subjective judgments and analyses and changes thereto and/or consideration of different or additional factors could have a material impact on the results indicated. Therefore, actual results may vary, perhaps materially, from the results contained herein. No representation or warranty is made by Silvercrest as to the reasonableness or completeness of such forward looking statements or to any other financial information contained herein. We assume no responsibility to advise the recipients of this document with regard to changes in our views.
This communication contains the personal opinions, as of the date set forth herein, about the securities, investments and/or economic subjects discussed by Mr. Teeter. No part of Mr. Teeter’s compensation was, is or will be related to any specific views contained in these materials. This communication is intended for information purposes only and does not recommend or solicit the purchase or sale of specific securities or investment services. Readers should not infer or assume that any securities, sectors or markets described were or will be profitable or are appropriate to meet the objectives, situation or needs of a particular individual or family, as the implementation of any financial strategy should only be made after consultation with your attorney, tax advisor and investment advisor. All material presented is compiled from sources believed to be reliable, but accuracy or completeness cannot be guaranteed.
© Silvercrest Asset Management Group LLC


