Nowhere to Hide
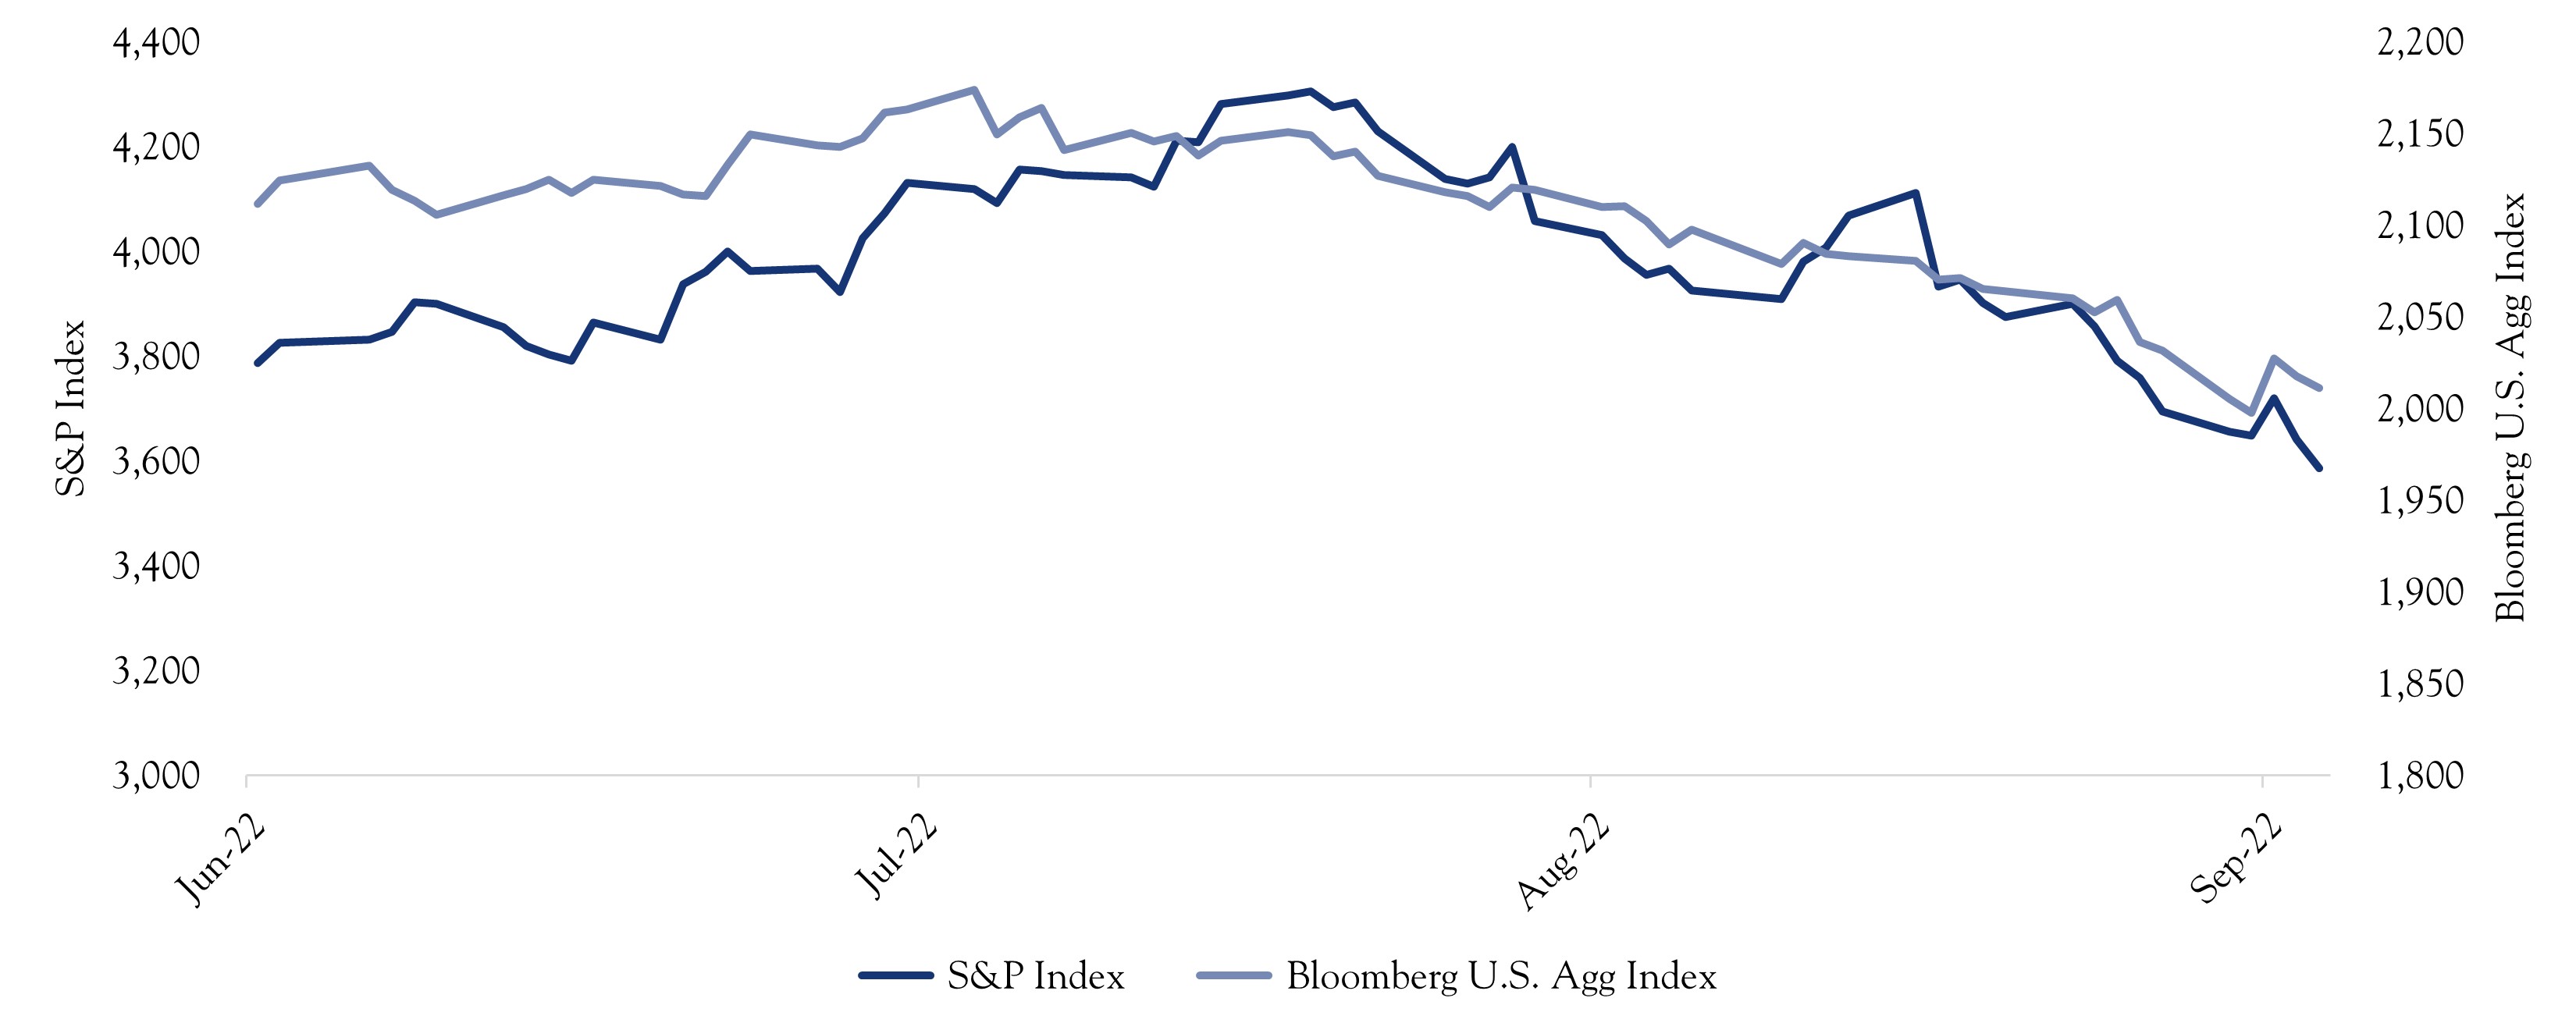
Through three quarters of this year, interest rates have been the dominant force behind investment outcomes. Changes in the predicted peak of the Fed Funds Rate have exerted a consistent, powerful, and damaging influence on stock and bond returns. It is rare for stocks and bonds to experience declines simultaneously. The reason for widespread pain is the one-two punch of inflation and the Federal Reserve’s hopeful efforts to tame it by boosting interest rates. Markets reacted sharply to these two factors in the third quarter, both positively and negatively. From mid-July to mid-August stocks staged a powerful +12% rally as inflation fears ebbed. Then, in late August, Fed Chair Jerome Powell brought inflation fears to the fore at Jackson Hole, saying the Fed’s “overarching focus right now is to bring inflation back down to our 2% goal.” His remarks sent markets into another tailspin, continuing through September as the Fed’s terminal rate moved higher.
The following graph shows the large-scale rally and sell off that took place during the quarter, ultimately ending with a loss of −4.88% for stocks and −4.75% for bonds. Year-to-date through September 30, the S&P 500 declined by −23.9% and the Barclays Aggregate Bond Index by −14.6%. There were few safe havens.
A Determined Federal Reserve
The Fed has a dual mandate to achieve price stability and full employment. While Fed Chair Powell left it unsaid, the markets clearly understood that the Fed will laser focus on defeating inflation with little regard to the implications for the economy and employment. Despite market pain, the Fed takes a wise stance. The Fed has restored credibility, showing willingness to prevent embedded inflation by raising interest rates via the Fed Funds Rate. It is fortunate for the economy that the Fed has been able to enact this policy in an economic environment where jobs are plentiful and unemployment is low.
Higher Fed Funds rates filter through to rates on bonds, mortgages, and discount rates used in valuation analysis as well as many other important market metrics. The declines in stocks and bonds, painful as they are, indicate that markets have absorbed the Fed’s tough stance and willingness to increase the Fed Funds Rate in its effort to defeat inflation. As seen with the mid-quarter market rally, small changes in the inflation and rate outlook trigger big moves in asset prices. When and where will the rate hikes subside? We find clues to this puzzle hidden in futures contracts and inflation metrics.
Expectations in Futures
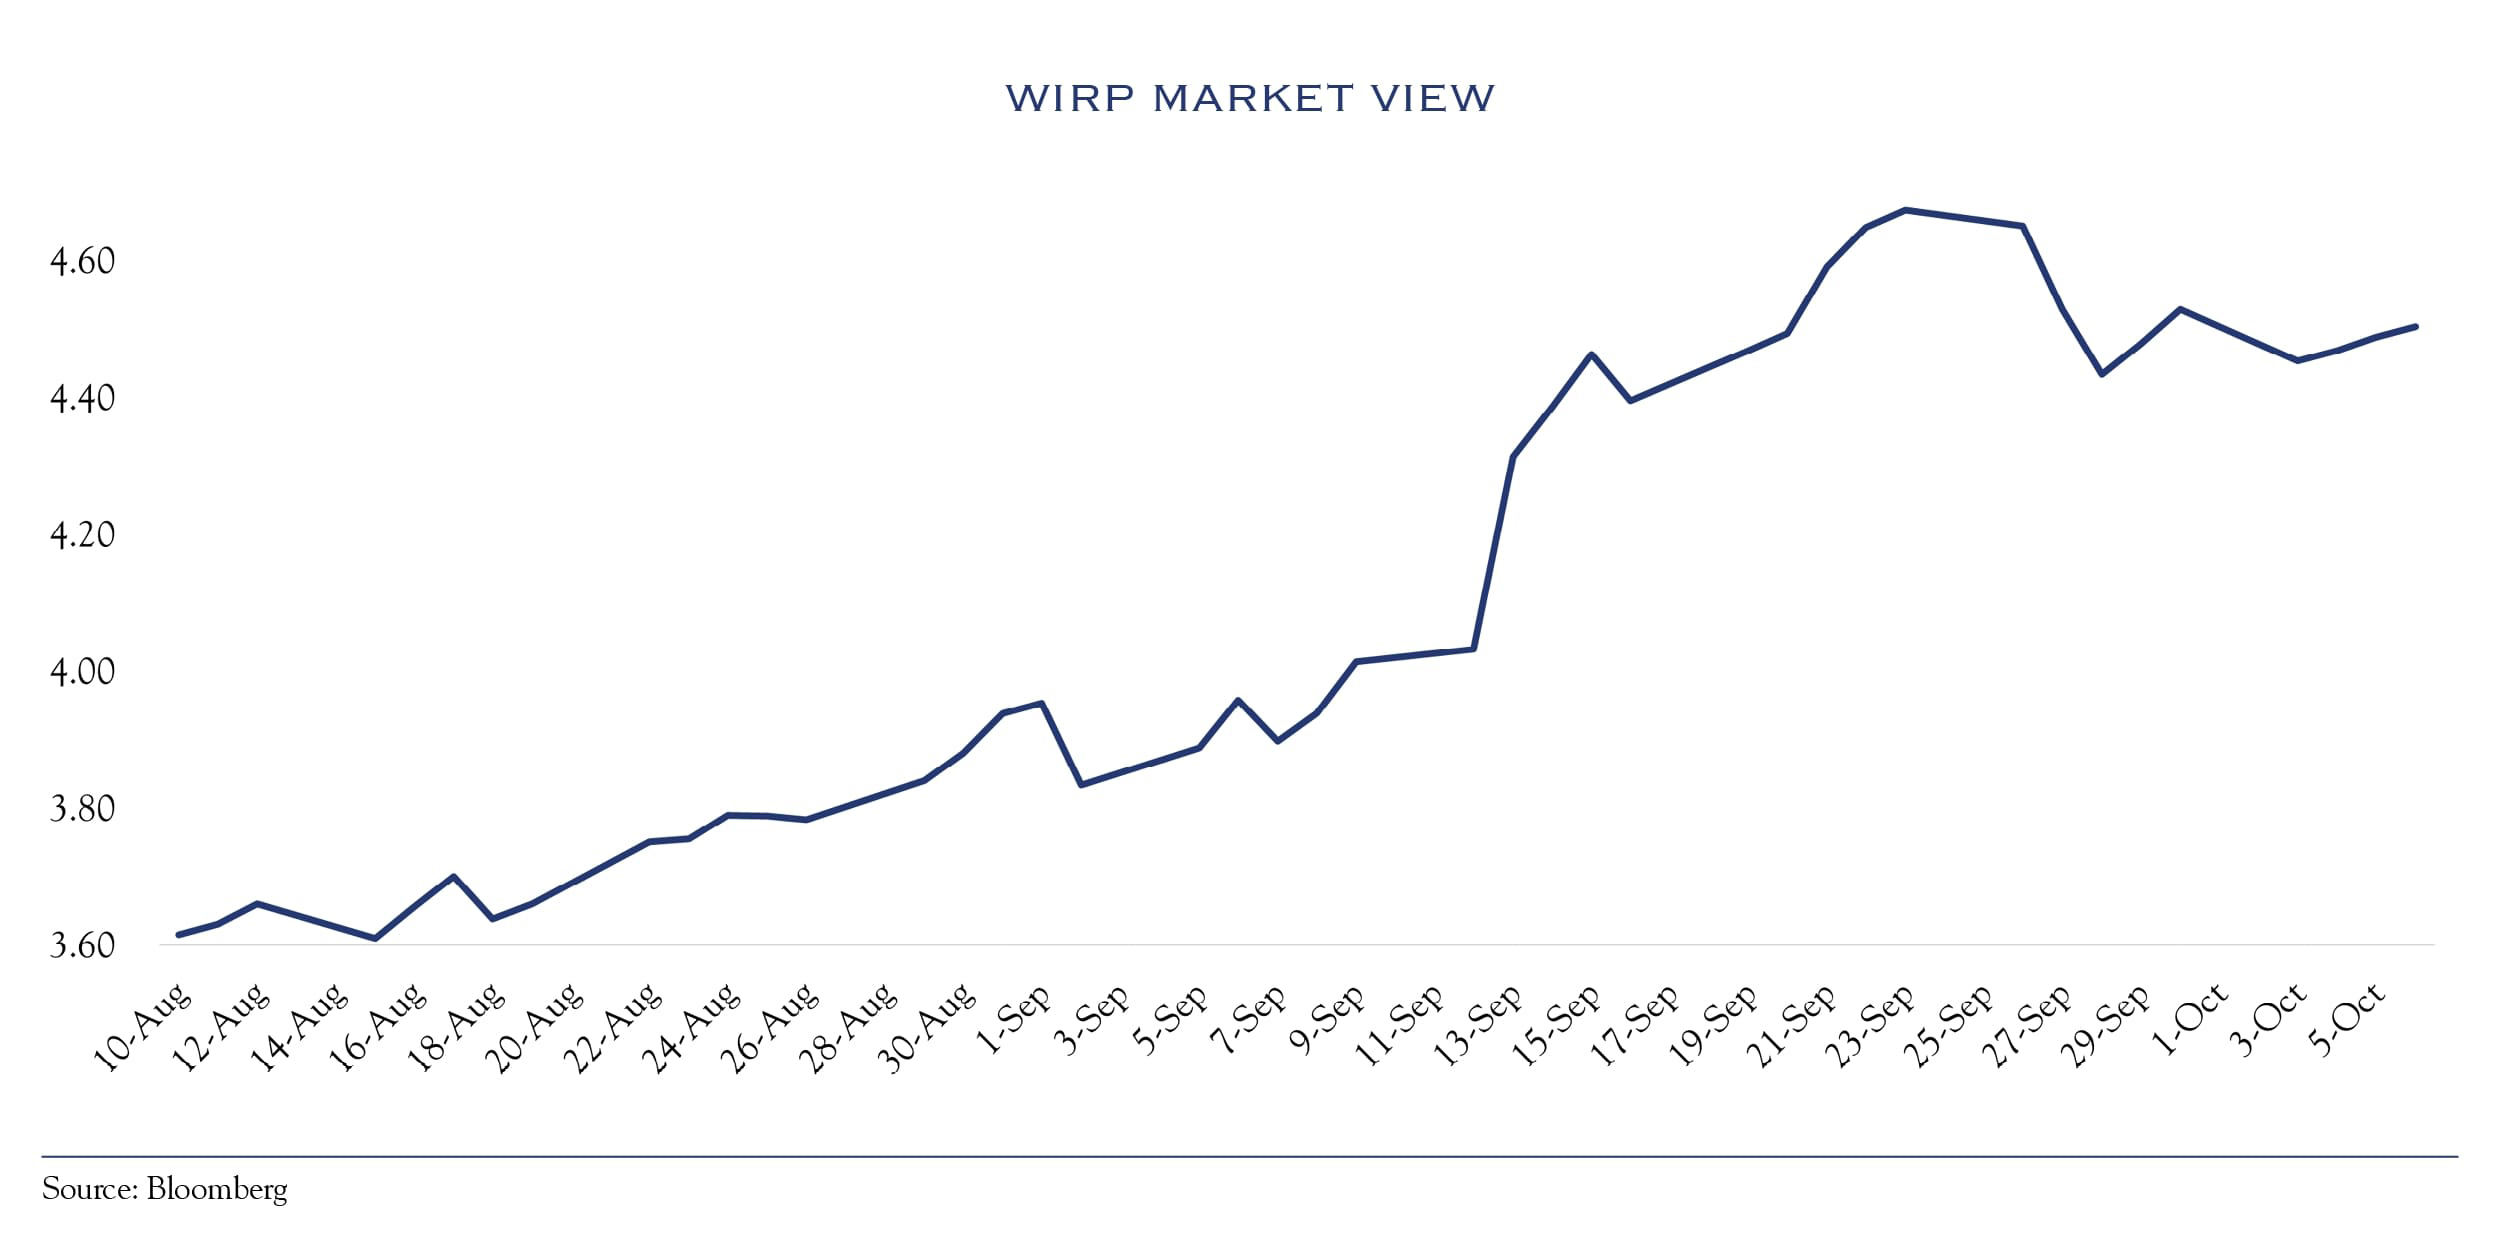
Expectations embedded in futures contracts based on the Fed Funds Rate provide one important clue. Bloomberg’s World Interest Rate Probability (WIRP) showcases the market view of upcoming Fed Funds Rate changes, painting a picture of the anticipated peak interest rate and the date it will arrive.
As can be seen in the following chart, two weeks before Fed Chair Powell spoke on August 26th, investors expected a peak Fed Funds rate of 3.3% occurring in March. Just over a month later, expectations hit a high of 4.7%, with the peak expected in May. This additional 150 bps of rate hike expectations coincided with a decline of about −10% in stocks. Shortly thereafter, expectations changed just a bit, with the peak rate expectation declining to a 4.5% high, expected in March.
Inflation
Other clues are found in a wide range of inflation metrics. Absent inflation, rates become a non-issue, and the Fed goes from foe to friend. The table below outlines various inflation measures and price indicators.
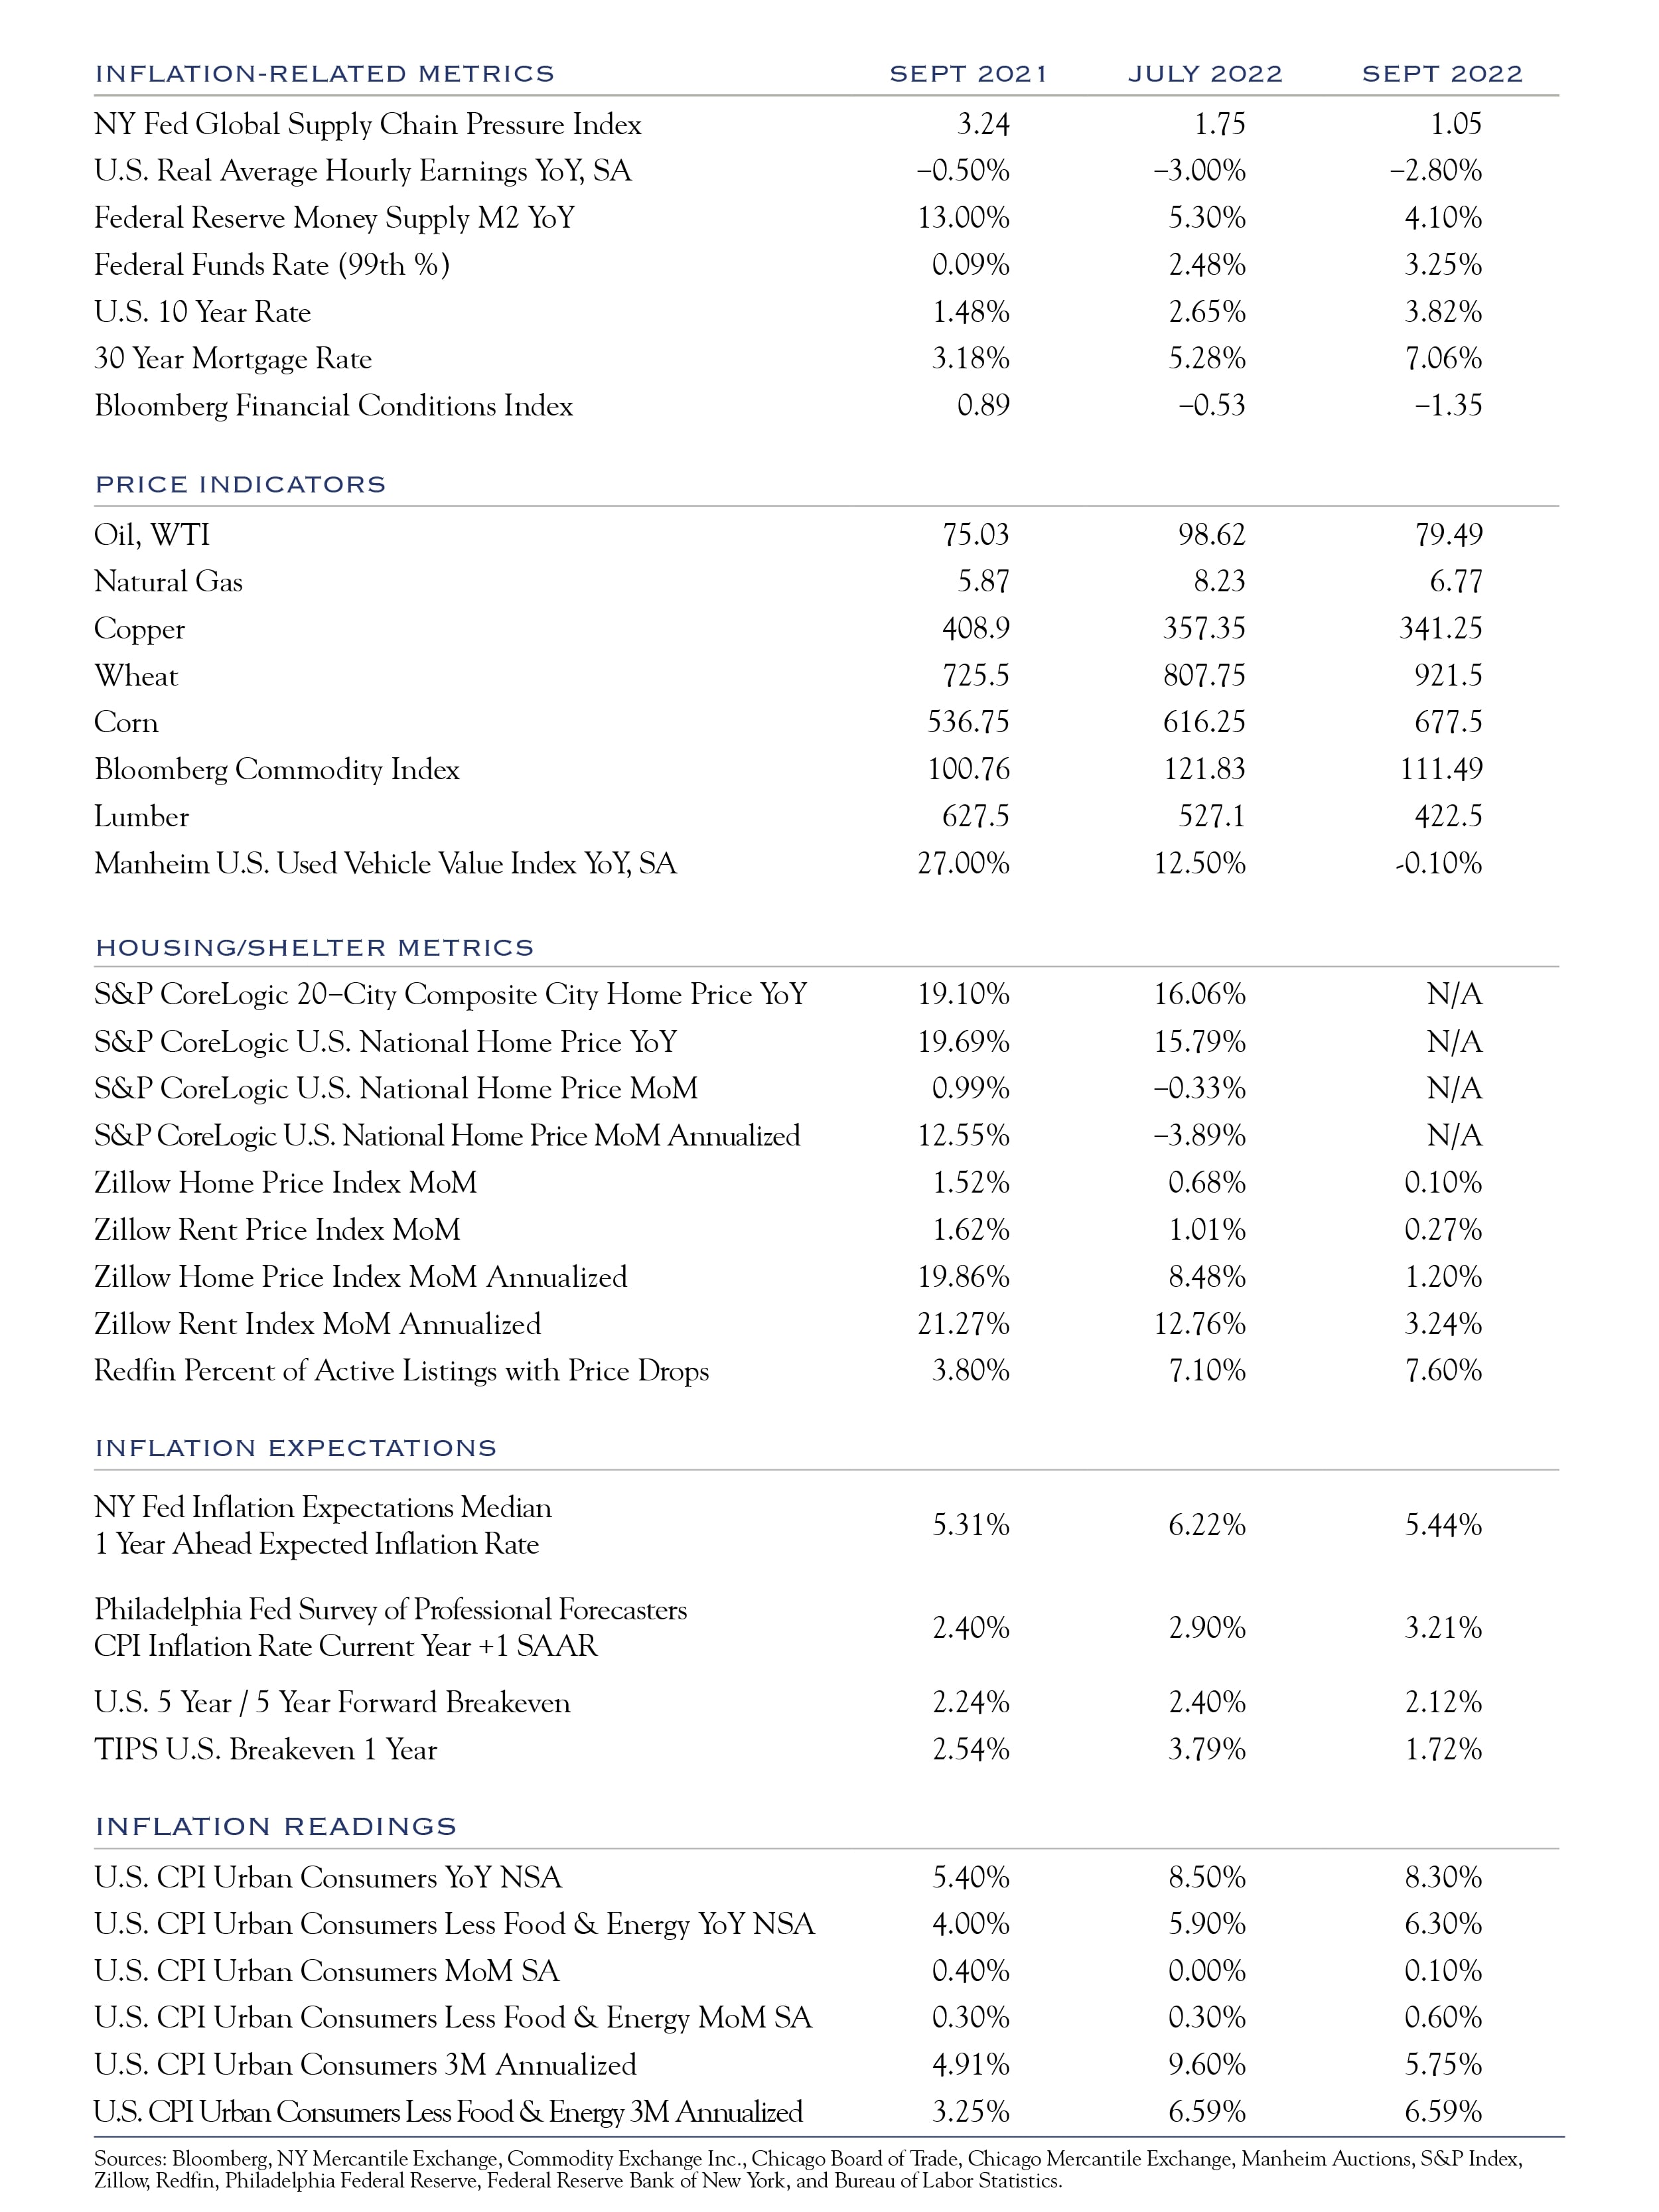
Encouragingly, recent surveys from the ISM’s Purchasing Manager Index indicate easing price concerns. The ISM Manufacturing Prices Paid Index has dropped from 76.1 in January to 51.7. Shipping rates also indicate less stress in the supply chain, lower transportation costs, and perhaps a slowing economy. Consider that the BDI Baltic Exchange Dry Index—one of many measures of shipping costs—declined from a peak of 3,369 to 1,760. A recent webinar by global logistics firm Flexport similarly described improvements in transportation and supply chains and noted that inventory levels have generally recovered to normal levels. This bodes well for moderating prices (lower future inflation).
In addition to supply chains and logistics, a simplified inflation model might consider the COVID-era fiscal and monetary stimulus. The fiscal stimulus that flowed into goods prices largely has been spent. Robust monetary stimulus supported financial assets, including thousands of digital coins and new “assets” such as non-fungible tokens (NFT); trading in these assets has halted. A recent Bloomberg article cites over 12,000(!) varieties of crypto tokens have effectively ceased trading this year. In 2022, the broad crypto space saw $2 trillion in total asset value destruction, and U.S. stock values have declined by over $5 trillion. For context, from 2020-2022, the M2 measure of money supply grew by about $5 trillion and has ceased growing.
Simply put, inflation was bad and getting worse, and it’s now bad and getting better. When inflation was accelerating, it was perfectly sensible for the Fed to increase pressure on the economy by raising rates at a rapid clip of 75 bps per meeting. This level of increase has been merited but is rare. Dating back to 1971, there have been 9 hikes of 75 bps as compared with 17 hikes at 50 bps, and 50 increases of 25 bps. When the Fed meets in early November to determine its next move, the primary question should be whether further rate increases will help bring inflation down faster. However, just because the Fed should ponder that question, it does not mean it will. It remains highly likely that the upcoming Fed meeting will provide another opportunity for tough talk and action on rates. Eventually, the Fed will acknowledge progress against inflation has been made, that other economic stress is building, and that economic cooling is underway. At that point, a pause in rate hikes will be merited. Based on live market data (not backward-looking CPI measurements), that moment is approaching, with peak rates currently expected in March at levels about 100 bps higher than current rates.
Overall, when reviewing the data, our view is that the Fed will try to thread the needle by continuing to hike at smaller sizes while simultaneously laying the groundwork for a pause. This would be seen as progress by markets and likely lead to stabilization in rates and valuation metrics.
Half Full Economy
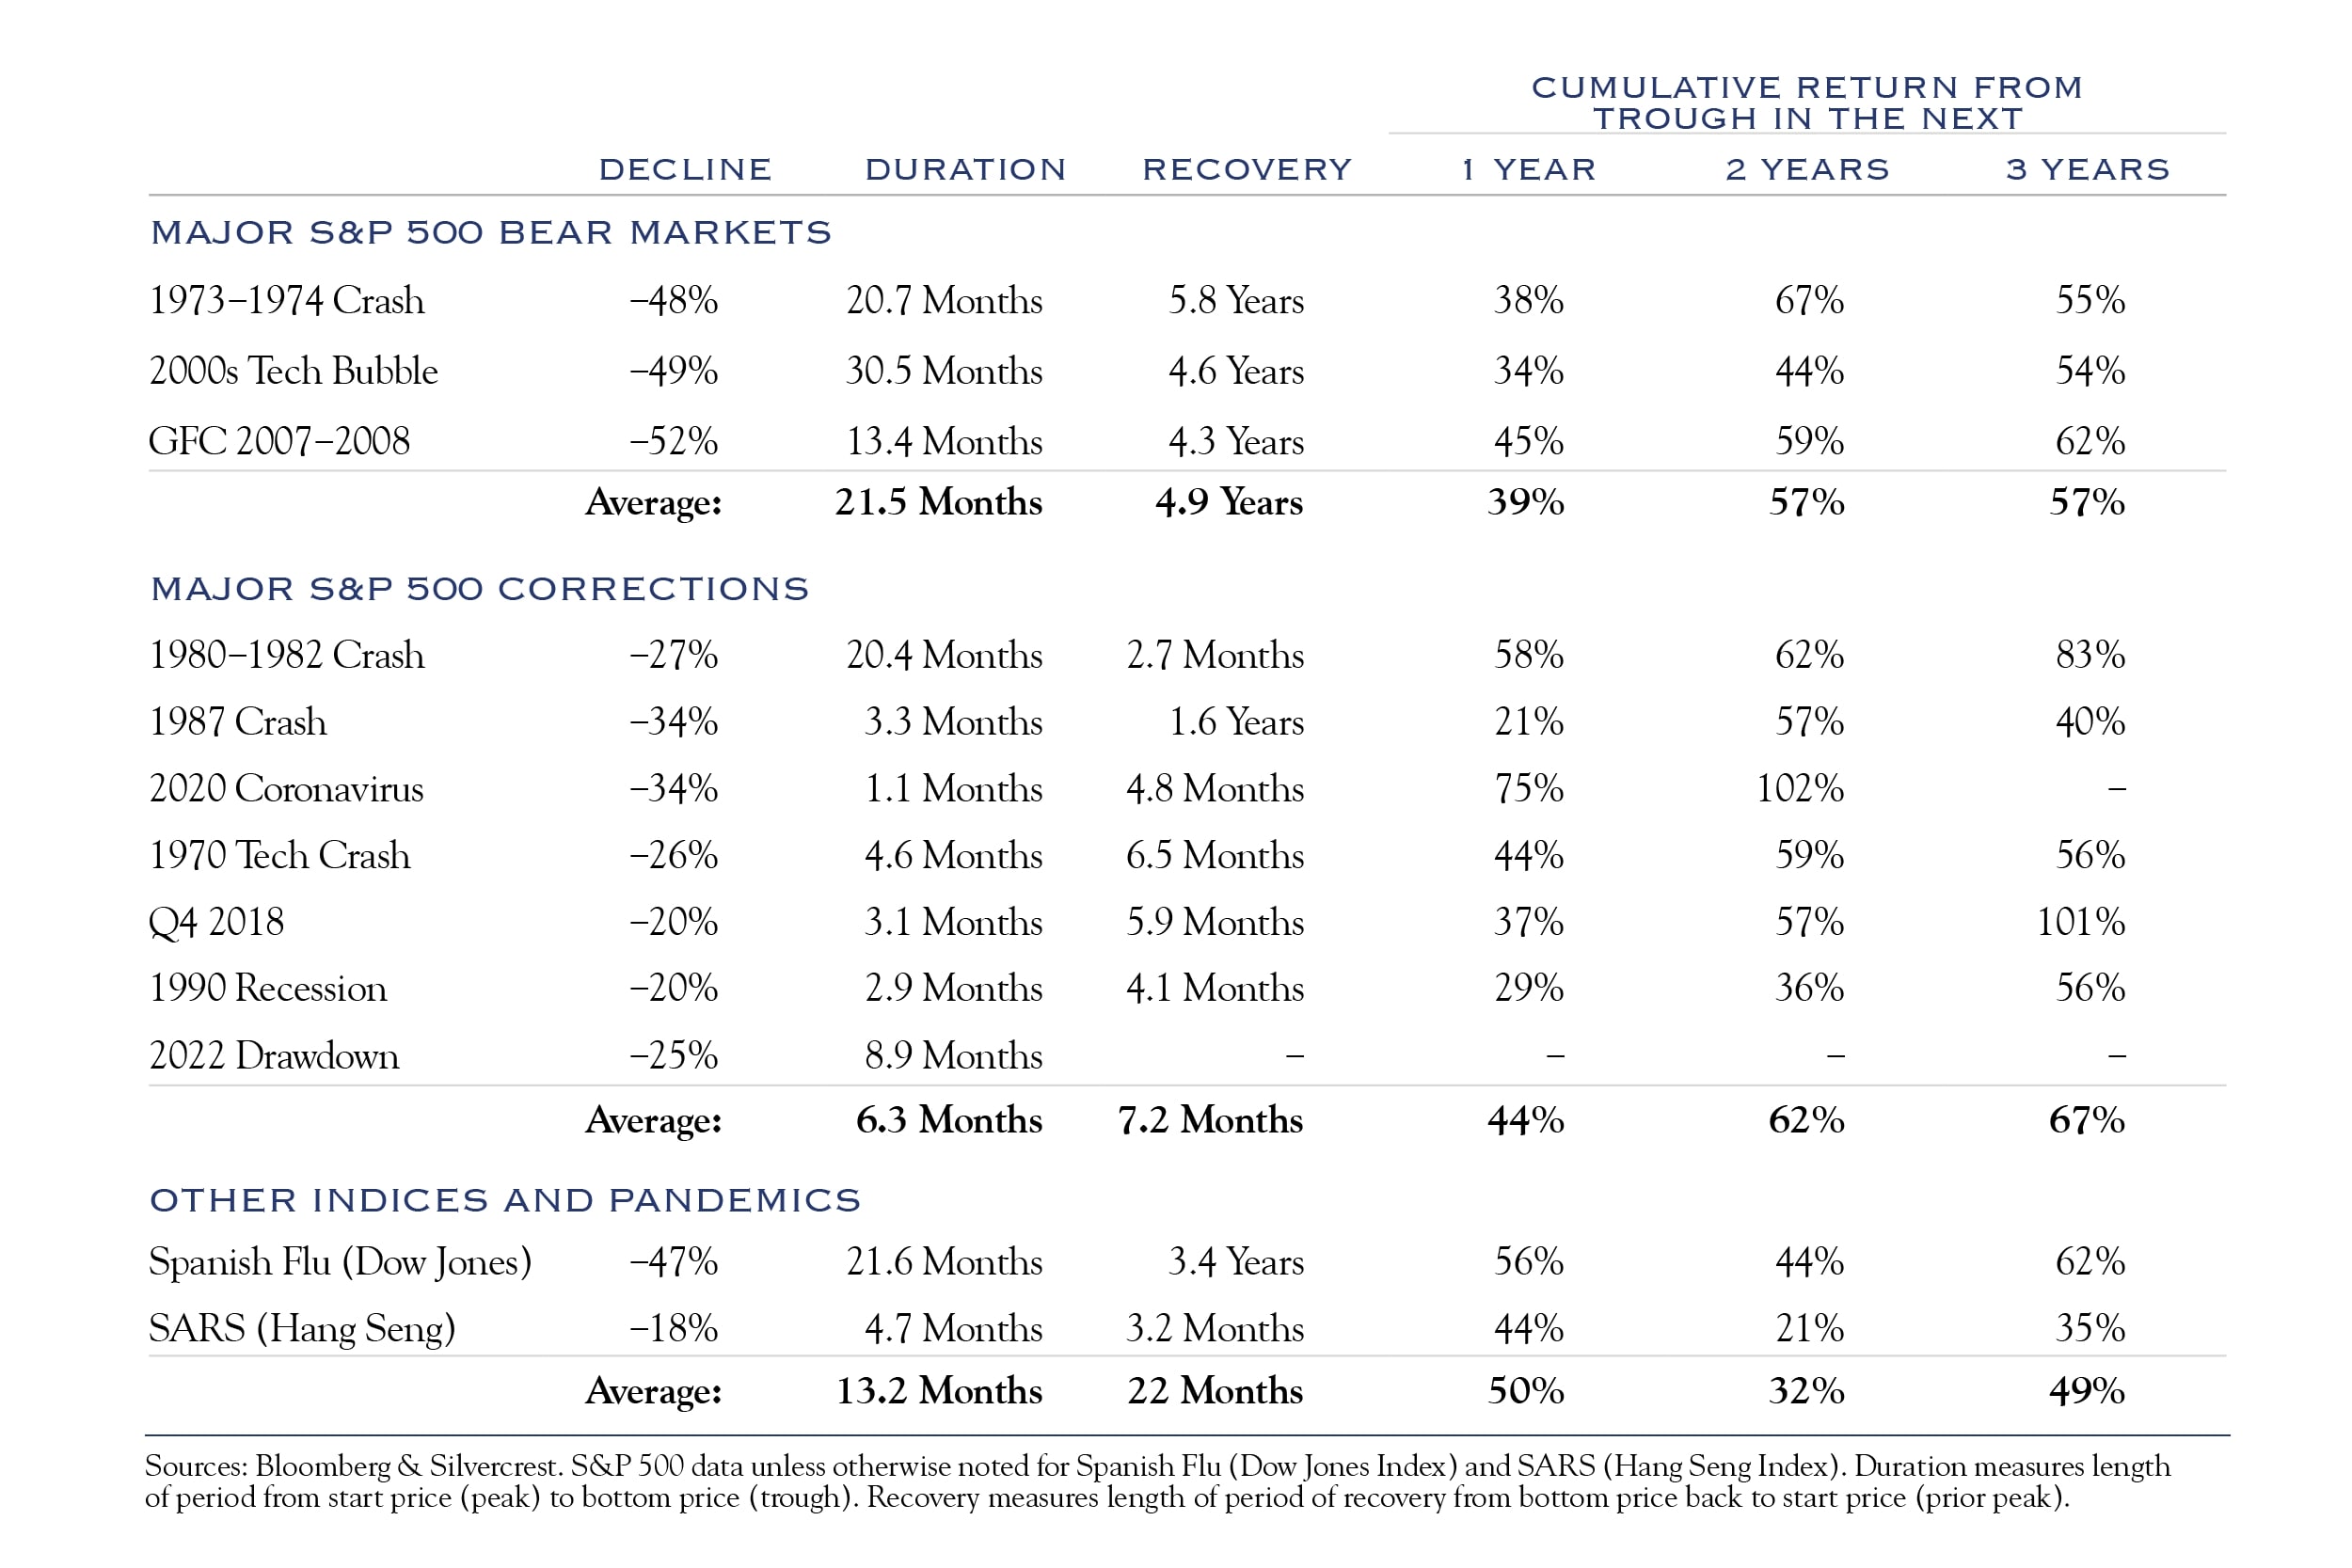
As the Fed cools the economy, signs of slowing have emerged, although it is important to distinguish between a slow-growth economy and a serious recession. Historically, markets have weathered major corrections in a range of −20% to −34% while major bear markets typically have declines around −50%. (See the table below.) We think any economic slowdown will be relatively mild, primarily because of the strong labor market and relatively solid balance sheets across consumers and businesses. We don’t expect robust economic growth but do think that anemic growth or a mild recession is more likely than a powerful recession. Thus, we look for markets to remain within the “normal” correction category in the table below.
A few economic metrics tell a comprehensive story. Foremost is the job market. Consumers, dependent upon jobs and income, primarily drive and influence the U.S. economy. Or, as it was once explained to me by a ten-year-old friend many years ago: “Food comes from money; money comes from jobs; and jobs come from people.” Now that’s a succinct and powerful description of the U.S. economy!
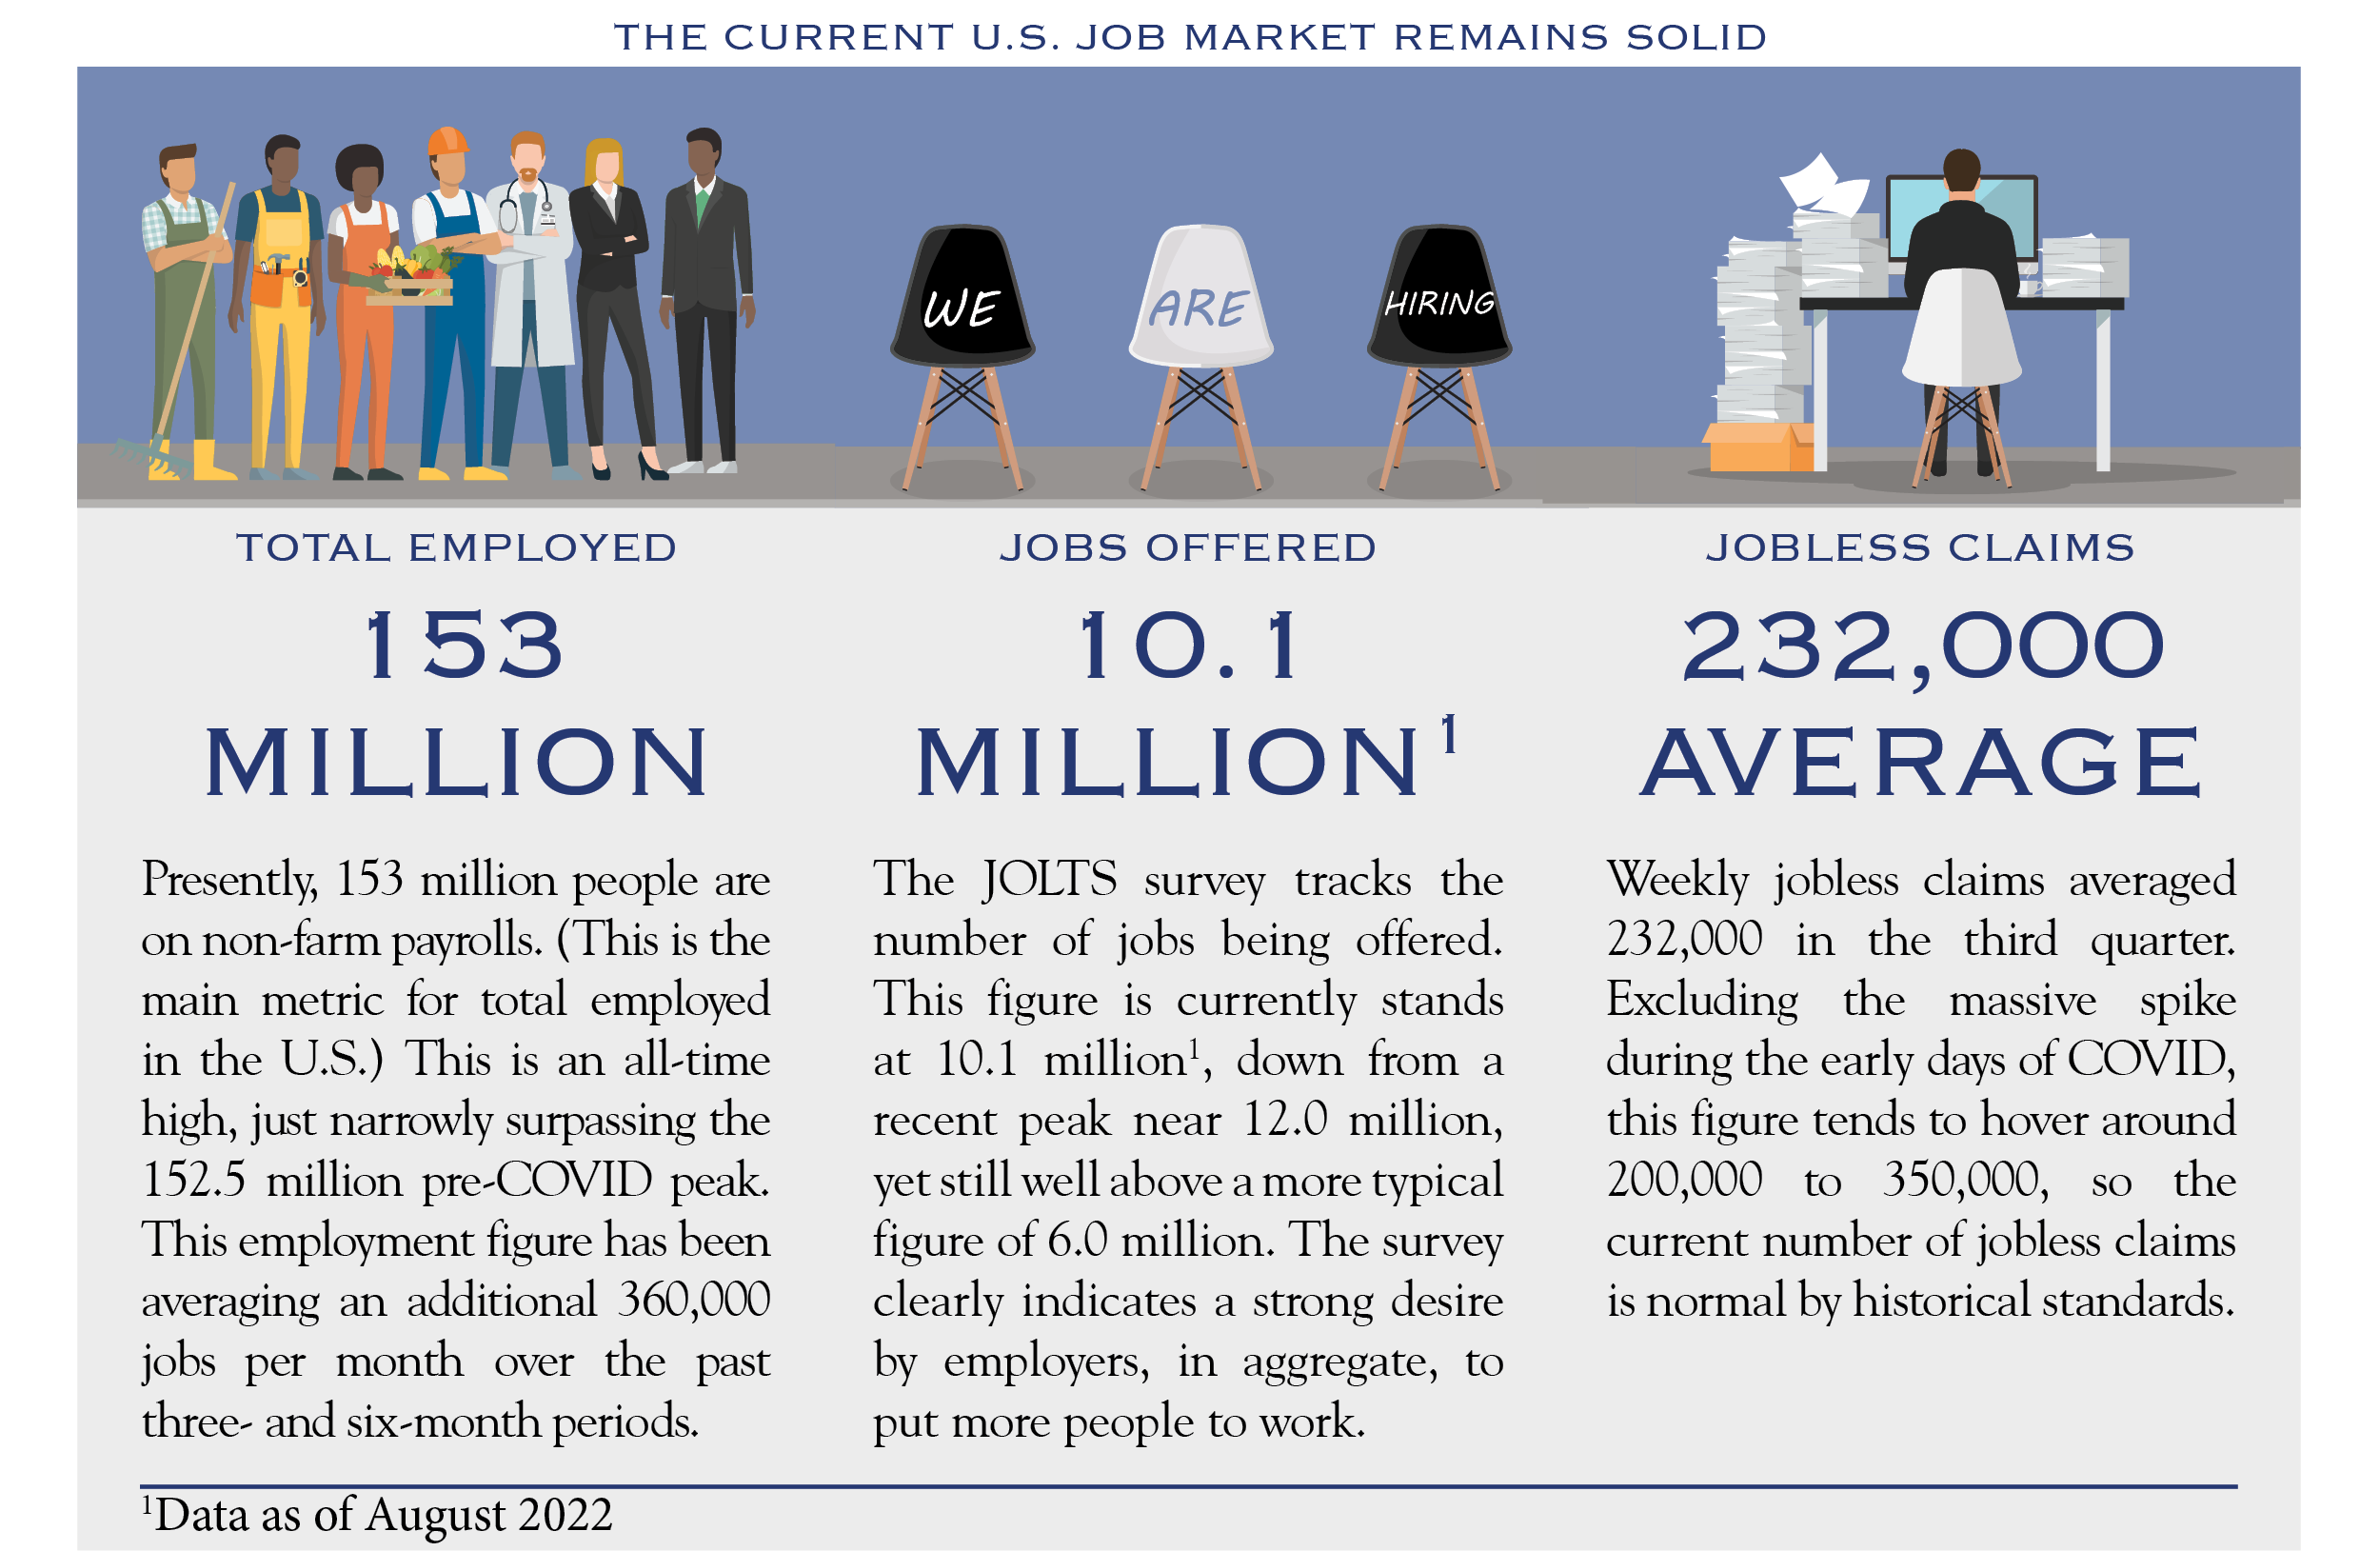
Some more prominent economic indicators show that the economy is expanding slowly.
- ISM Manufacturing: The ISM manufacturing survey for September posted a reading of 50.9. Figures over 50 are expansionary, so this represents a small amount of positive economic growth in the manufacturing segment of the economy.
- ISM Services: The ISM Services Index posted a reading of 56.7, also expansionary and at a faster rate than manufacturing.
- Economic Models: The Atlanta Fed and the New York Fed each produce economic models widely followed for their depth of analysis. The Atlanta Fed’s metric—GDPNow—utilizes economic data to estimate the current growth rate of components of GDP. This model estimates an economic growth rate of 2.3% for GDP. The New York Fed’s Weekly Economic Index was devised to incorporate ten daily and weekly indicators of economic activity, scaled to GDP growth. This indicator presently shows an estimated GDP growth rate of 2.7%.
Taken together, jobs, corporate surveys, and economic models depict an economy in a slow-growth mode. In our view, this represents a return to long-term trends characterized by slow growth. This lethargy results from a long history of minimal gains in the engines of economic growth via increases in both population and productivity. Nonetheless, slow growth is preferable to a major recession.
Global Gloom
Outside the United States, problems abound. Europe’s use of Russian-supplied energy has created a massive challenge. In Europe, inflation runs hot while everyone hopes for a warm winter, lest energy problems become more pronounced. Saber-rattling from Russia continues, and it would be foolish to claim any sort of predictability for the conflict in Ukraine. The United Kingdom’s challenges were exacerbated when issues with financial plumbing and pension funds caused the Bank of England to adopt the unusual policy of hiking rates to stem inflation, while simultaneously standing by to buy bonds to stabilize markets. China is still muddling through a Zero-COVID policy and an over-built and leveraged housing market. Japan, the largest component in the MSCI ACWI ex-U.S. Index, continues to suffer from devastating demographics.
These problems are well-documented and generally reflected in current asset pricing and discounted valuations as compared with the U.S. In fact, within the MSCI ACWI ex-U.S. Index, 85% of securities have posted a decline on a year-to-date basis. Clearly, there are few success stories for global equities this year. The relative strength of the U.S. versus other countries contributes to further dominance by the U.S. Dollar. The dollar has advanced this year by +15.5% against a standard basket of currencies and has advanced by +8.6% versus a trade-weighted basket of currencies. The magnitude of this move is quite rare and creates a headwind for non-U.S. stocks.
As global conditions normalize, we expect currencies to stabilize, removing one key headwind from non-U.S. equities. With the appropriate risk tolerance and time horizon, investors can find great opportunities in excellent companies who trade cheap to global peers simply on the basis of their domicile.
U.S. Outlook
We expect anemic economic growth—but not a major recession—and a stable job market, slow earnings growth, a decline in inflation, and a stabilization of interest rates. For the remainder of the year, signs of an improved investment environment will come with better inflation numbers as well as continued job market stability. Earnings will continue to be a focal point, particularly company commentary around demand, margins, and inventory levels. Companies will provide a mixed picture, as conditions have varied widely across industries, and management teams have varying degrees of success in navigating the challenges of this tricky and twisting economy.
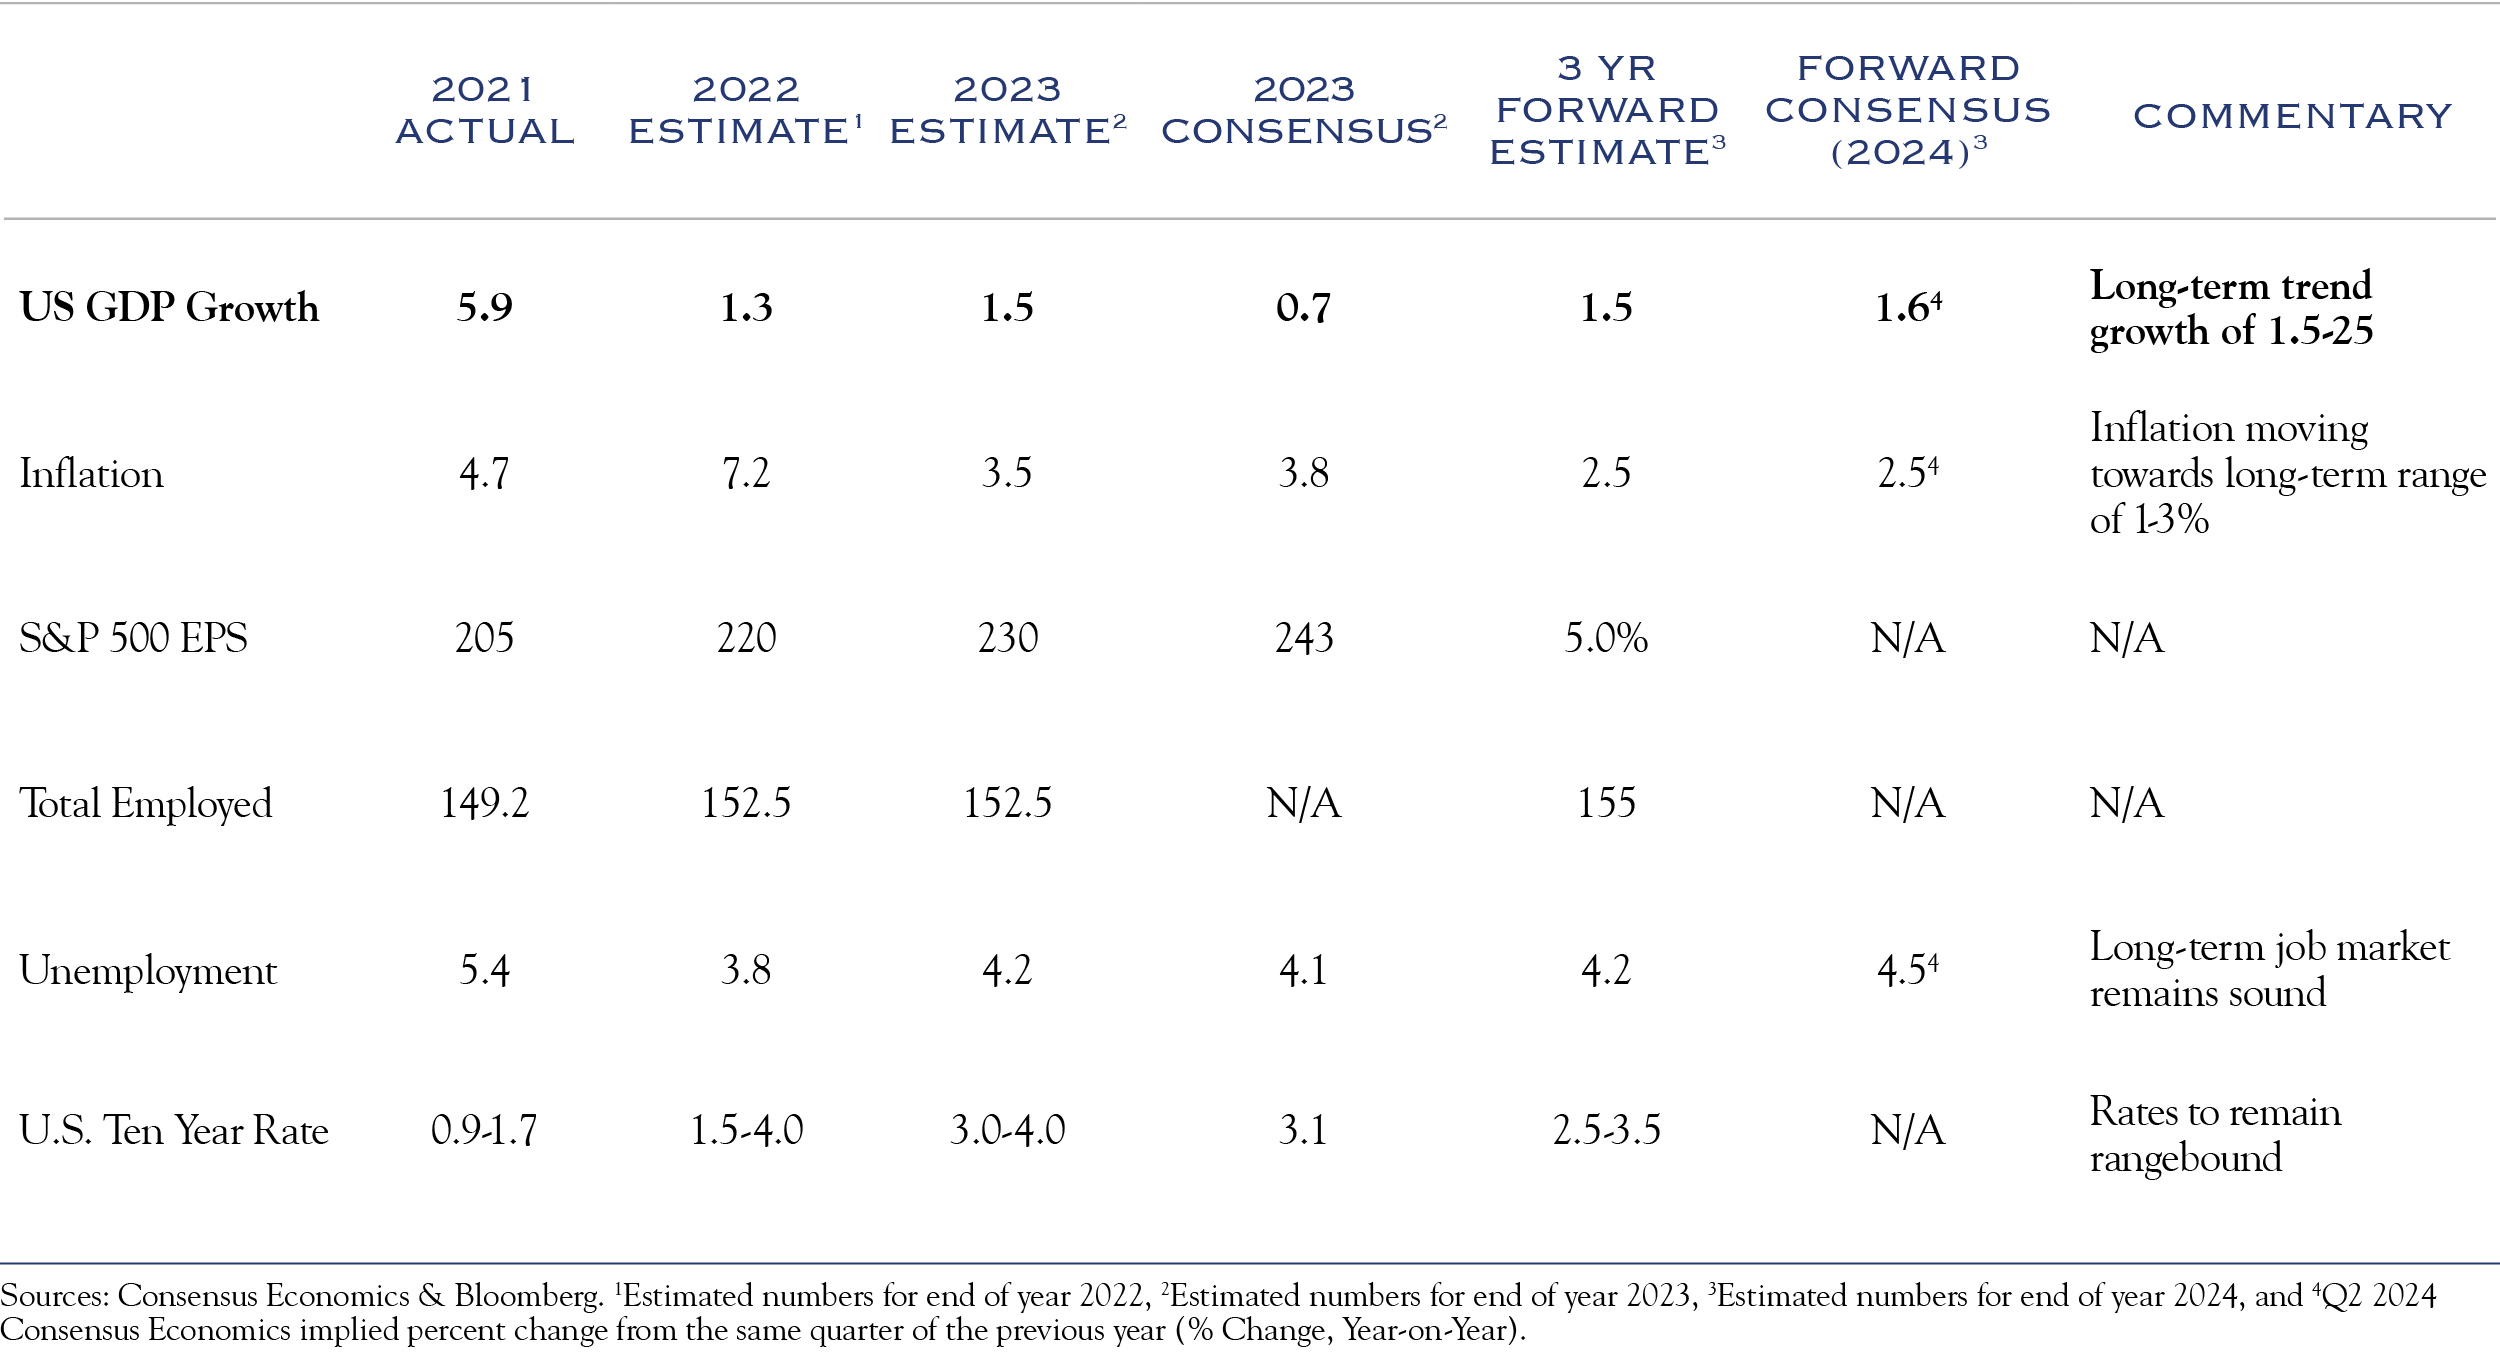
Our Earnings & Valuation Model constructs a three-year forecast based on expected earnings growth as well as anticipated changes in valuation. We estimate valuation changes by assessing the current conditions for fundamental, policy, and sentiment versus historical ranges. Presently, we anticipate a challenging but improving environment across inflation, interest rates, domestic policy, and the geopolitical backdrop. The model’s output results in current “fair value” for P/E ratios at a level lower than historical averages. Over the next few years, we anticipate improving conditions, especially regarding inflation. We expect to see earnings, dividend yields, and a slow improvement in valuations to create an expected U.S. equity return in the mid-to-high single digits for equities over the next three years. For fixed income, we anticipate a stabilization of rates in a fairly wide range and look for bonds to earn their yield.
With inflation under such intense scrutiny and responsible for so much short-term market direction, our outlook anticipates continued challenges and volatility in the short term. We have modest, but positive, expectations over the next few years.
This communication contains the personal opinions, as of the date set forth herein, about the securities, investments and/or economic subjects discussed by Mr. Teeter. No part of Mr. Teeter’s compensation was, is or will be related to any specific views contained in these materials. This communication is intended for information purposes only and does not recommend or solicit the purchase or sale of specific securities or investment services. Readers should not infer or assume that any securities, sectors or markets described were or will be profitable or are appropriate to meet the objectives, situation or needs of a particular individual or family, as the implementation of any financial strategy should only be made after consultation with your attorney, tax advisor and investment advisor. All material presented is compiled from sources believed to be reliable, but accuracy or completeness cannot be guaranteed. © Silvercrest Asset Management Group LLC


