Autumn ushers in the seasonal traditions of back to school, election year politics, and investors returning from the beach. This year has been full of superlative-generating events and there is plenty to reflect upon. Markets care little for yesterday, however, only a bit more for today, and are mostly focused on the future.
Today, we think the market reflects a pragmatic and mostly reasonable interpretation of current and anticipated conditions. Due to the wide-ranging destruction from COVID and the uneven recovery, it is more important than ever to go beyond a simplistic interpretation of data—whether in assessing economic recovery or evaluating investment opportunities. In aggregate, we believe most key fundamental metrics regarding the economy and markets support a rational read on what we have learned thus far about how the economy functions in a modern era pandemic.
Consider the charts below for key indicators at December 2018, December 2019, the COVID-low, and currently. Each is scaled such that 2019 represents the base, or 100%.
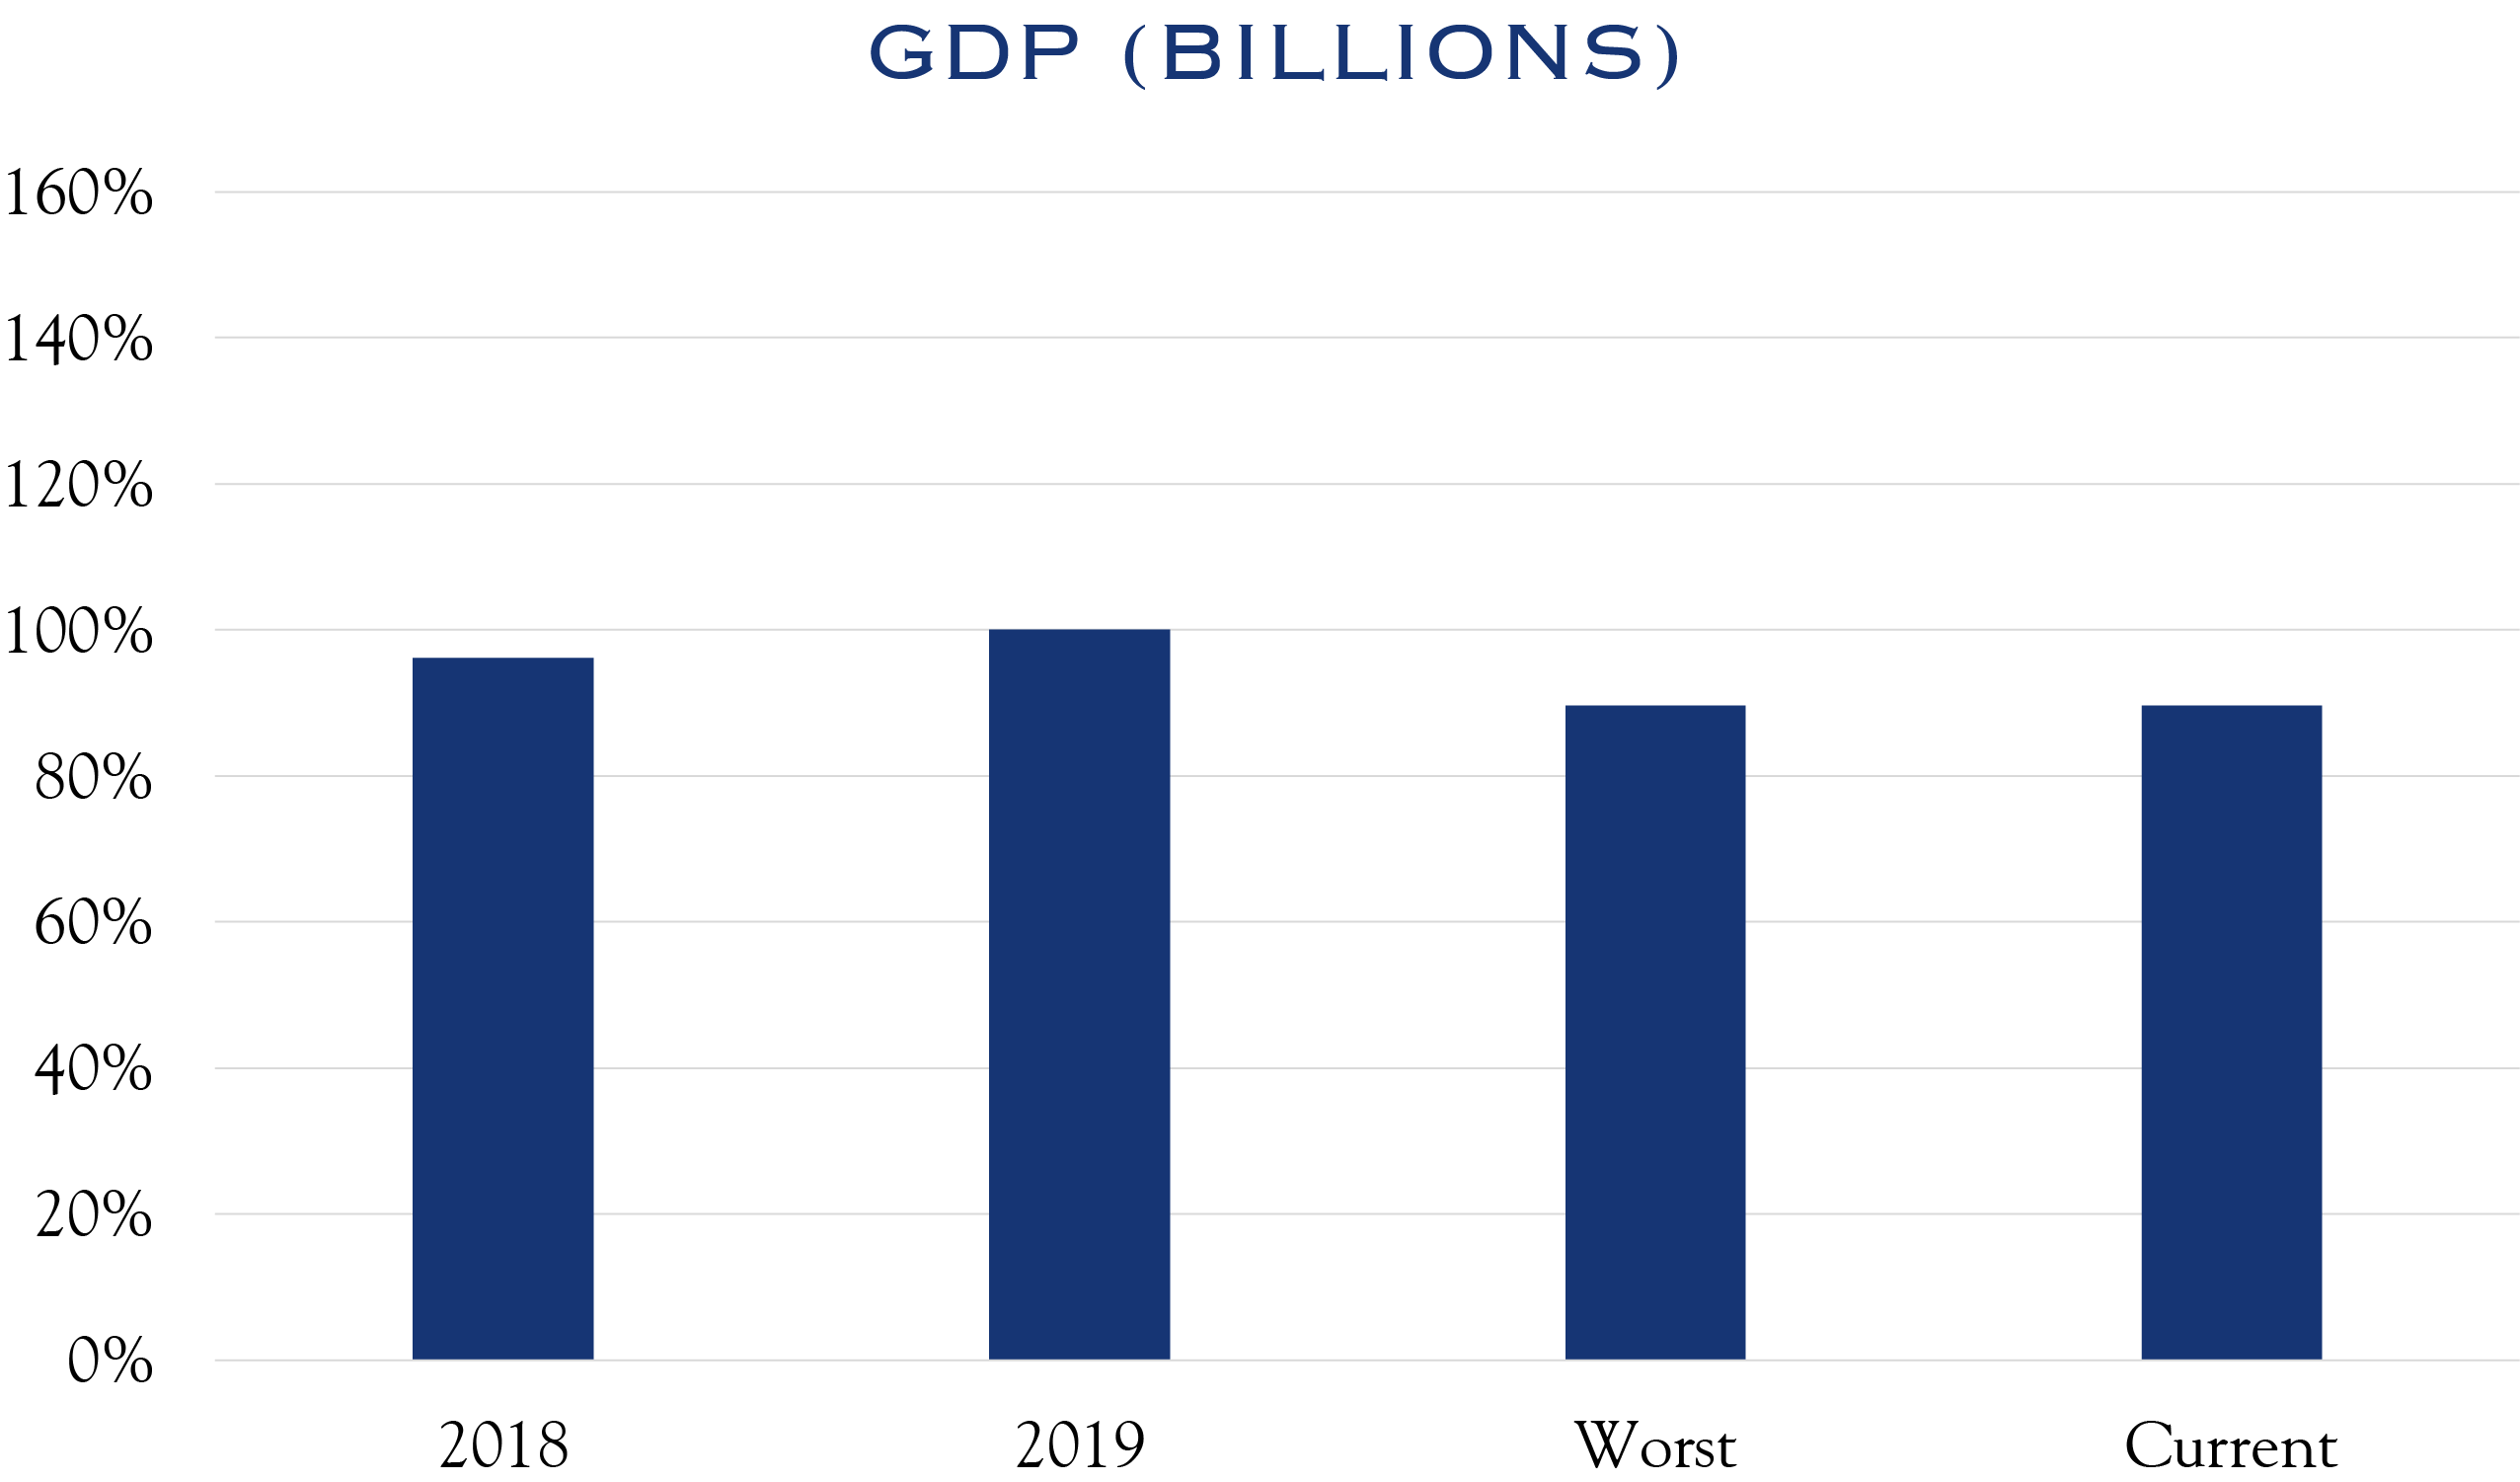
Official GDP figures are released quarterly, so the most recent data is as of June 30. However, short-cycle alternative data show an economy running at 95% of the prior year. Figures above represent total employed—a useful statistic for gauging how much income is available in the economy. Today, total employed of 141 million is comparable to levels last seen in 2015.
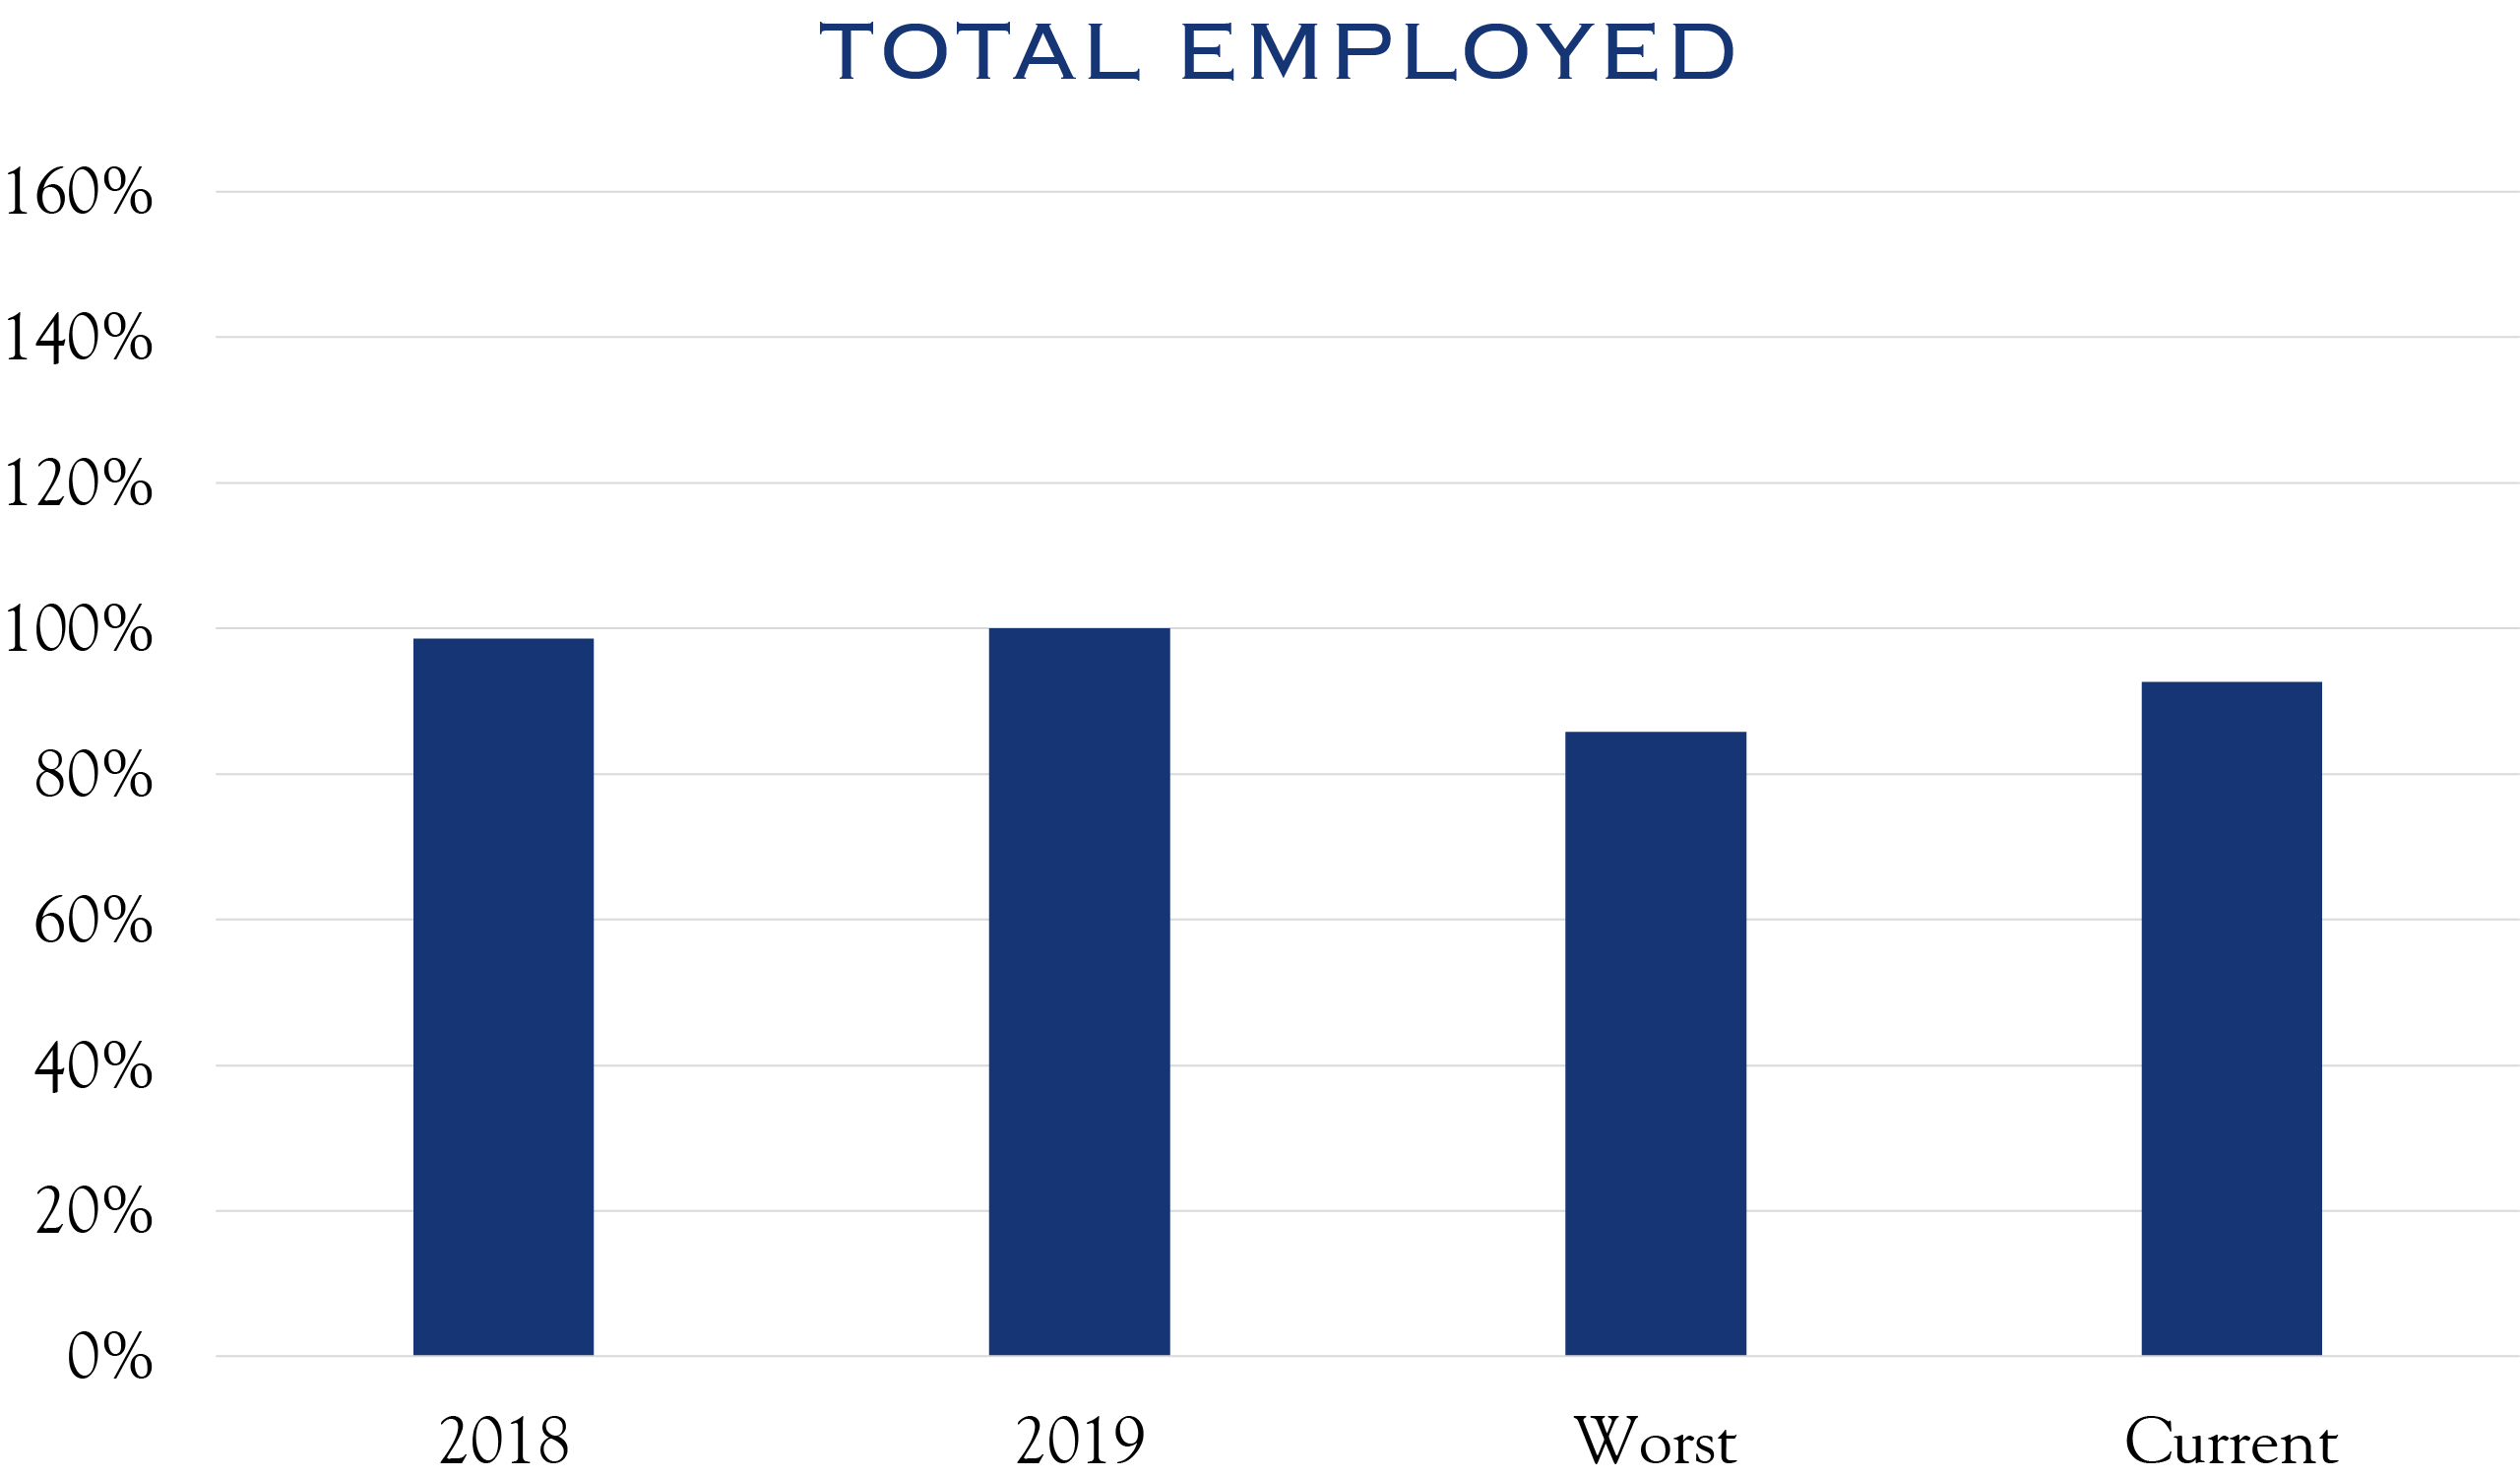
Figures above represent total employed—a useful statistic for gauging how much income is available in the economy. Today, total employed of 141 million is comparable to levels last seen in 2015.
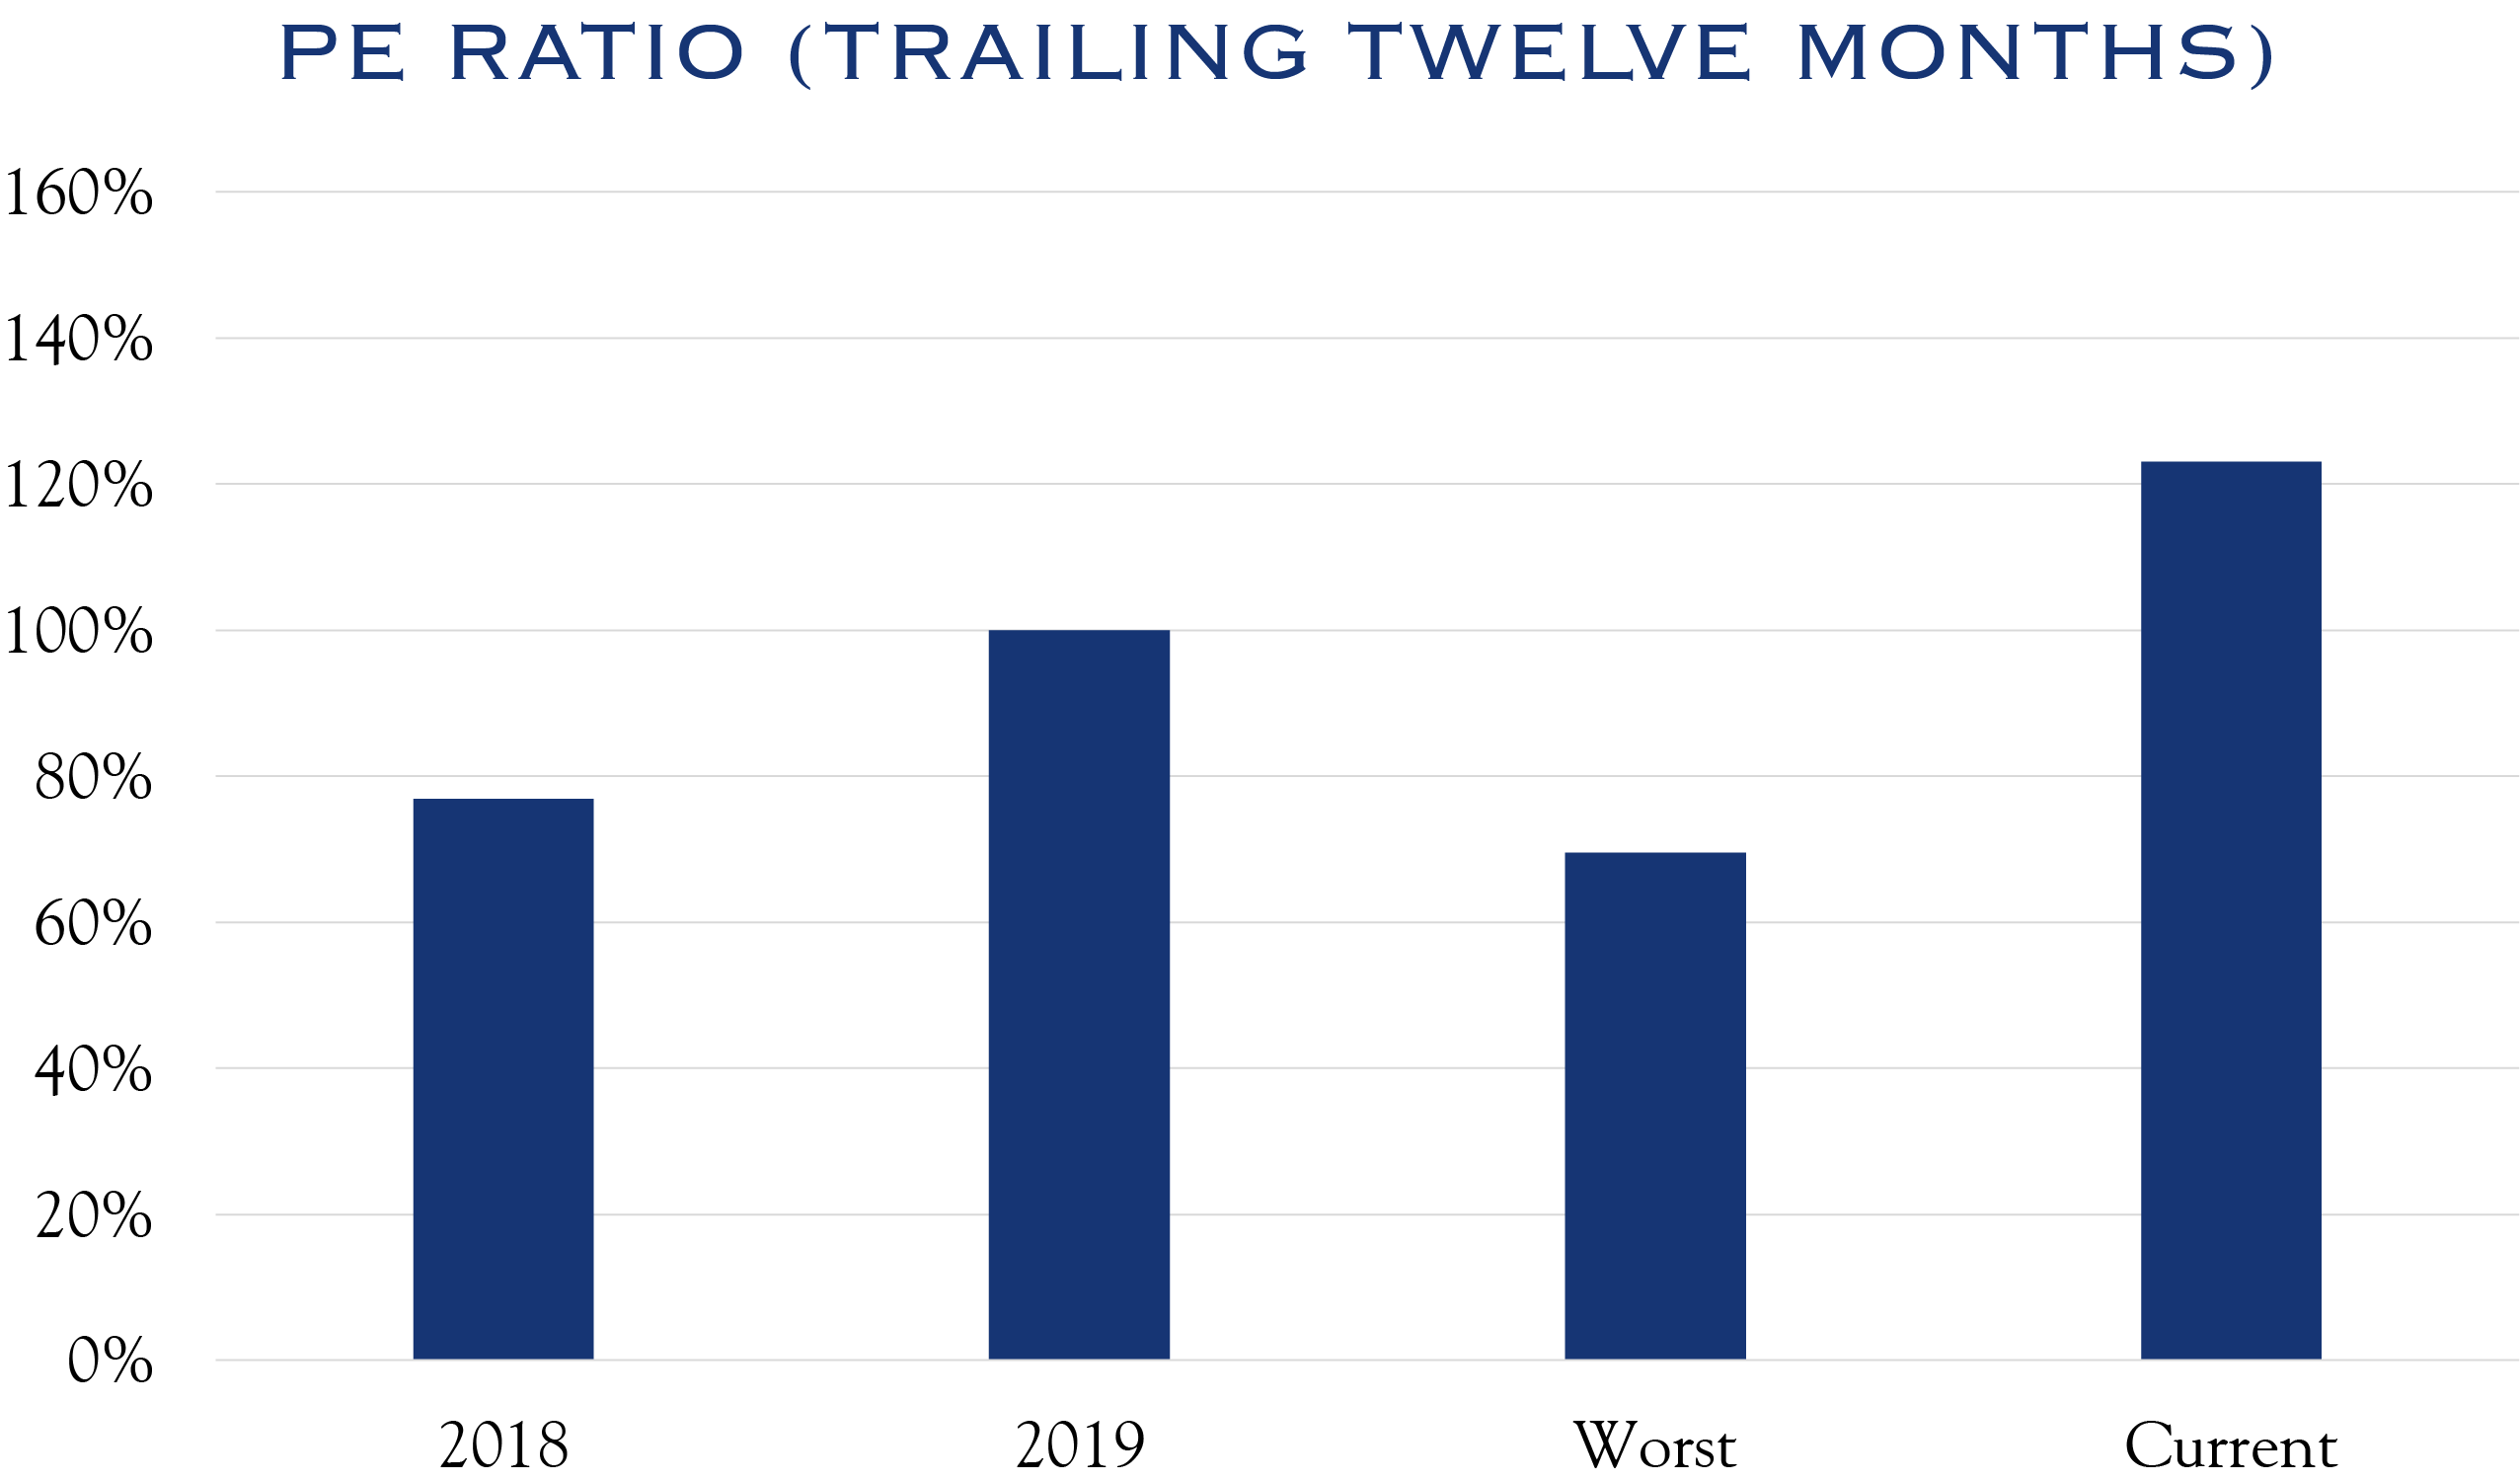
Investors often focus on PE ratios using expected earnings. Trailing PE ratios can be useful in that they use actual, rather than estimated data.
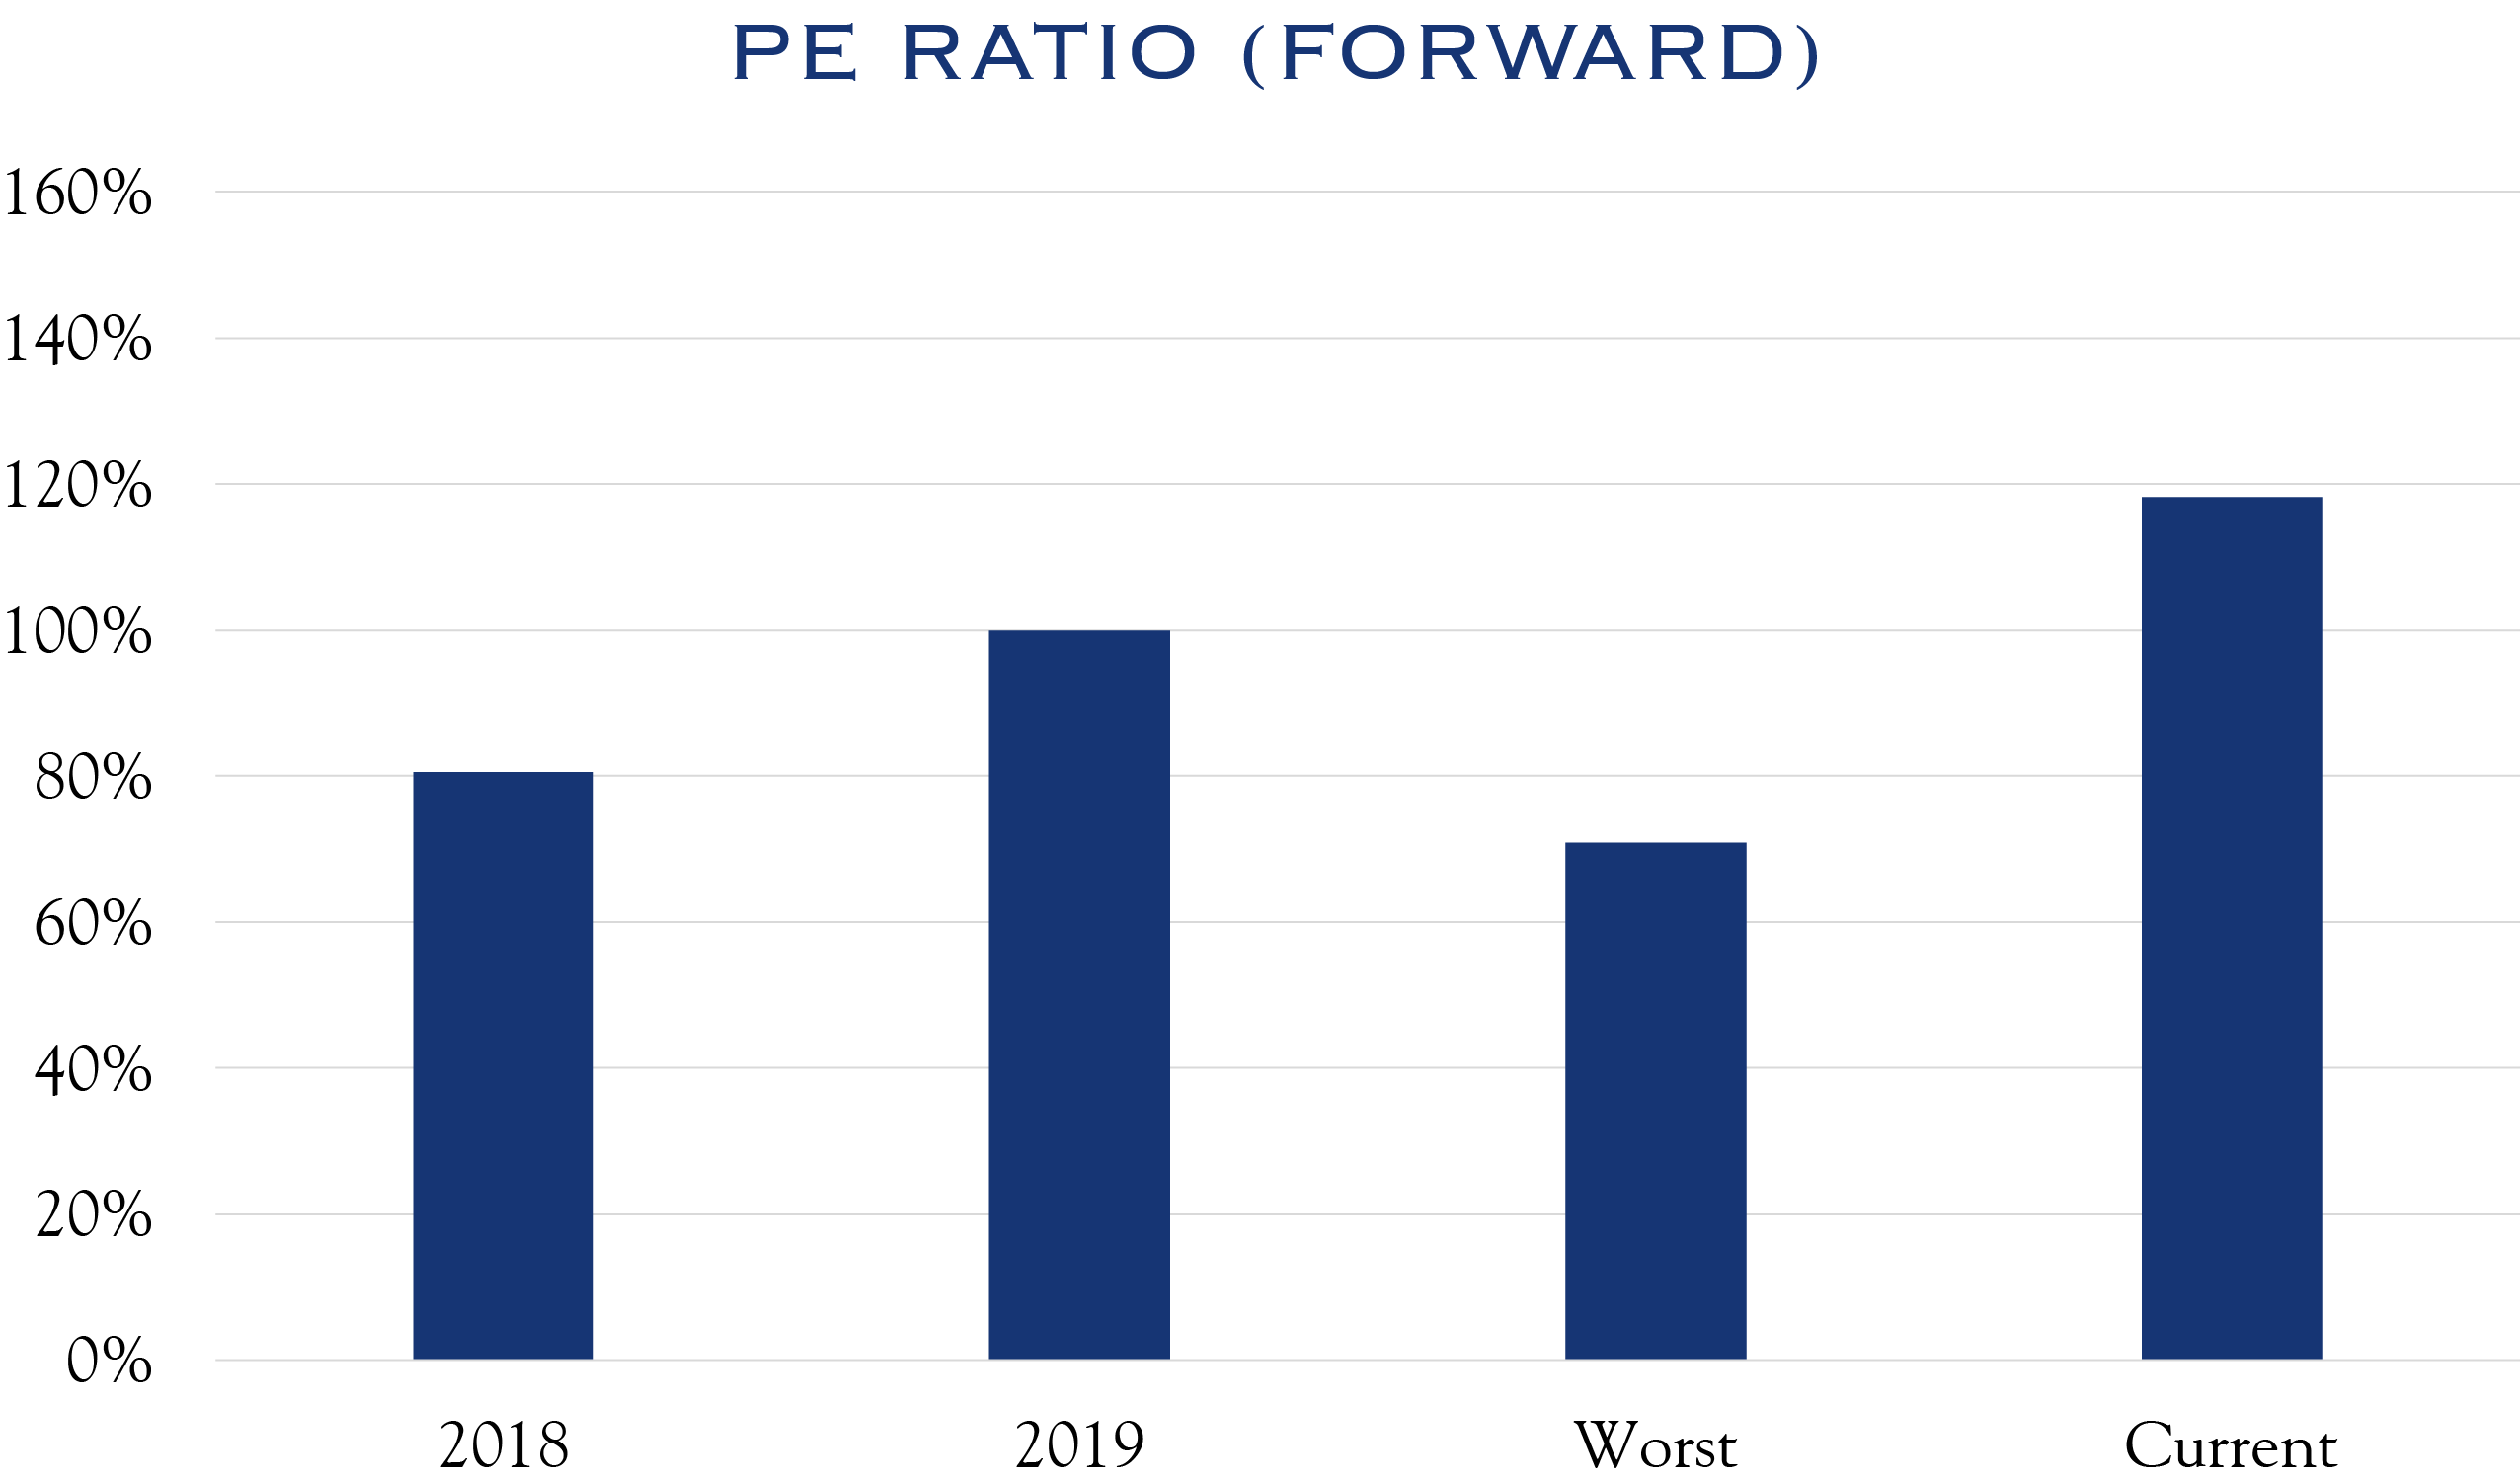
While PE ratios based on future expected earnings are elevated, there are important factors supporting this condition. First, earnings estimates for 2021 have been rising lately, as the recovery comes into clearer focus. Second, PE ratios should be viewed relative to interest rates. As rates are significantly lower, higher multiples are well supported.
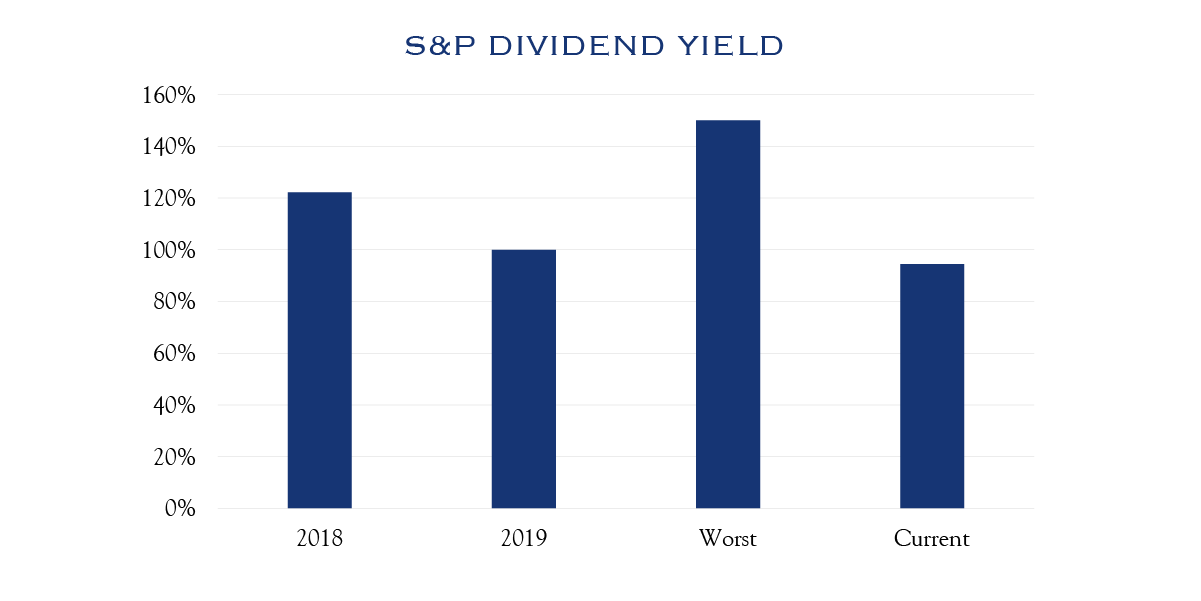
Dividend yields on equities are below peak levels, and lower than offered last year. However, relative to interest rates, the 1.7% yield is compelling.

In a signal of investor risk aversion, bond prices have risen and yields have fallen, such that the risk-free return offered is well below prior levels. In other words, safety offers very little return.
The table below shows the raw data for each fundamental metric at the time frames referenced in the charts above.

Source: Bloomberg
Compared with expectations in the cold and dreary spring, markets surprised investors in August with further gains—especially in areas where COVID has been least disruptive. Last month, the S&P 500 was up +7.2%, while small cap stocks in the Russell 2000 gained +5.5% and non-U.S. stocks measured by the MSCI ACWI ex-U.S. index gained +4.3%. Year-to-date through the end of August, the S&P 500 was up +9.7%, while small cap stocks were down −5.5% and non-U.S. stocks declined by −3.1%. Clearly, there are strong divergences of opinion across market segments. These divergences are near historically wide levels and we expect them to moderate as recovery continues. Further, markets have been narrow, in that very few stocks are keeping pace with the benchmark, as gains are concentrated in the largest holdings in the index. This has caused the equal weight index to lag the market cap weighted index by 12%. Further, less than half the stocks in the S&P 500 have a positive return for the year through early September. However, and encouragingly, in recent weeks, there have been some signs that neglected areas are attracting some attention and we expect this to continue.
Gains in the broad market benchmarks are creating interesting dynamics amongst the short-term, active trader community, particularly those focused on calendar-year results. Increases in volatility have led to greater hedging and attempts to manage risk levels on a short-term basis. Further, massive amounts of options trading, along with the corresponding response of dealer desks, have further exacerbated short-term fluctuations. Momentum is a powerful feature—in both directions. We counsel patience and a tolerance for this short-term, trading-driven volatility.
COVID remains the key driver of economic activity; however, the virus is far better understood, and we are better adapted to it compared with its earliest days. This has allowed investors to assess the future according to COVID’s influence on economic and market activity—highly destructive in some areas, minimally disruptive in others.
Alongside continued positive developments on treatments and vaccines, some disrupted areas of the market have begun to recover. For example, over 60% of consumer discretionary stocks outperformed the S&P 500 index in the month of August. This compares to only about 30% of all stocks outperforming the index, which indicates that investors are branching out into areas dependent on economic recovery.
Wide-ranging opinions dominate consumer surveys as well. Consumer confidence levels, while down sharply from their pre-COVID peak, are at levels considerably above those seen in the Global Financial Crisis. While an imperfect comparison, Harris polls show that 76% rated the job market as “bad” in January 2009; today, 56% are very or somewhat concerned about jobs, while 44% are not at all concerned or not very concerned.
Overall, we believe markets remain reasonably well-grounded and our outlook remains modestly optimistic. COVID, the Fed, and the election will, in varying degrees, influence GDP and earnings. In turn, earnings, sentiment, and relative valuation will influence assets flows and future returns.
Here is our subjective “report card” and outlook for those key metrics with each scaled relative to history.

COVID conditions remain highly uncertain, though the overall level of cases and deaths has greatly moderated. Treatments are improving outcomes, preventative measures are allowing activity to proceed, and vaccines are progressing rapidly. The situation is disruptive and challenging but far improved from March/April.
The Fed remains highly supportive, both in words and actions, and has presented a consistent, stable, and forceful show of support.
Election season is heating up—polls and prediction sites show a tightening contest—both for the Presidency and the Senate. A combination of a divided electorate and the need to focus on COVID recovery, as well as an always uncertain legislative process, means that dramatic policy changes are unlikely until mid-2021, regardless of the outcome. Further, our independent research shows that one of the most commonly cited election “risk factors”—tax policy—plays less of a role than traditional fundamental factors. Specifically, periods with higher capital gains taxes did not play an outsized role in equity returns. The same is true for periods of higher corporate taxes. This is not to imply that higher taxes are irrelevant—they are not. However, for the long-term investor, other factors play a larger role such that the different tax regimes are not as powerful a predictor of results as conventional wisdom holds.
GDP—We draw heavily on alternative, short-cycle metrics to assess the overall economy. Indicators such as consumer mobility and spending data and the New York Fed’s weekly index show an economy running at 90–95% as compared with 2019. While the pace of recovery fluctuates, and sectors have wildly different situations, the recovery continues. A slower recovery places additional stress in some areas, confirming the need for security-specific analysis as balance sheets remain critically important.
Earnings—The improving economic backdrop has led to continued increases in estimates for 2021 earnings estimates. Consensus estimates are $166 for 2021, while our estimate remains at $158, representing the midpoint of a range from $150-165 and capturing a spectrum of likely recovery scenarios.
Relative Valuation—With U.S. Treasury risk-free yields near all-time lows, the dividend yield on equities is compelling. While equity valuations are near historical highs, low interest rates provide continued support. For the past five years, multiples have fairly consistently averaged 20x, while they have been above 18x over the past ten years. We believe valuations could increase if COVID risks continue to recede, recovery accelerates, and rates remain low going forward.
Investment Posture
The situation is far from perfect—yet it is improving. Markets will broaden and strengthen beyond the largest and most stable companies as the recovery continues. We believe investors should remain invested at a risk level appropriate to their specific circumstances. COVID continues to impose a painful and unpredictable influence on the recovering economy and markets. The difficult work of security-specific analysis and a willingness to embrace new economic metrics remains essential in this uneven economic recovery. We face these uncertain times, as always, with patience, a willingness to work hard, a reasonable time horizon, and modest expectations.
Henry Wadsworth Longfellow said it well in the poem, “A Psalm of Life”…
Let us, then, be up and doing,
With a heart for any fate;
Still achieving, still pursuing,
Learn to labor and to wait.
This communication contains the personal opinions, as of the date set forth herein, about the securities, investments and/or economic subjects discussed by Mr. Teeter. No part of Mr. Teeter’s compensation was, is or will be related to any specific views contained in these materials. This communication is intended for information purposes only and does not recommend or solicit the purchase or sale of specific securities or investment services. Readers should not infer or assume that any securities, sectors or markets described were or will be profitable or are appropriate to meet the objectives, situation or needs of a particular individual or family, as the implementation of any financial strategy should only be made after consultation with your attorney, tax advisor and investment advisor. All material presented is compiled from sources believed to be reliable, but accuracy or completeness cannot be guaranteed. © Silvercrest Asset Management Group LLC


