“They began to gather in the small harvest they had, and to fit up their houses and dwellings against winter…” (William Bradford as quoted in Thanksgiving: The Holiday at the Heart of the American Experience by Melanie Kirkpatrick).
Here in New York, we are set to embark on a stretch of short winter days with far less daylight than the long, sunny days of summer. Earth’s axial tilt and New York’s latitude make this a predictable recurrence. Unfortunately, bull and bear markets follow no such pattern.

Robert R. Teeter
Managing Director, Chief Investment StrategistEconomic & Market Overview
Solid growth in employment and growing GDP and controlled inflation have been the hallmarks of support for continued strength in equities.
Finding Value in Quality
We are again pleased to share commentary from our top-notch equity team. Roger Vogel discusses Equities.
A History of Market Declines
However, we can look to the past for some perspective. In “A History of Market Declines”, we outline the depth, frequency, and duration of market declines. Understanding market history is an essential element of creating portfolios that are robust over the long-haul.
Investigating Inflation
Inflation is a concept with many measurements and definitions. It is also being discussed with increasing frequency. Patrick Chovanec helps to frame some of the concepts and implications of inflation in a Q&A format.
Demystifying the Endowment Model
While endowment style investing has often embraced complexity, this approach has not always been rewarded. Drawing on eight years of experience managing a university endowment, Christopher Brown sheds some light on endowment and foundation investing.
Municipal Bond Update
We are again pleased to share commentary from our fixed income team. Patrick Bittner weighs in on Municipal Fixed Income.
Investment Outlook Summary
The Silvercrest Investment Policy & Strategy Group meets at least quarterly and we present a summary of our October meeting.
Economic & Market Overview
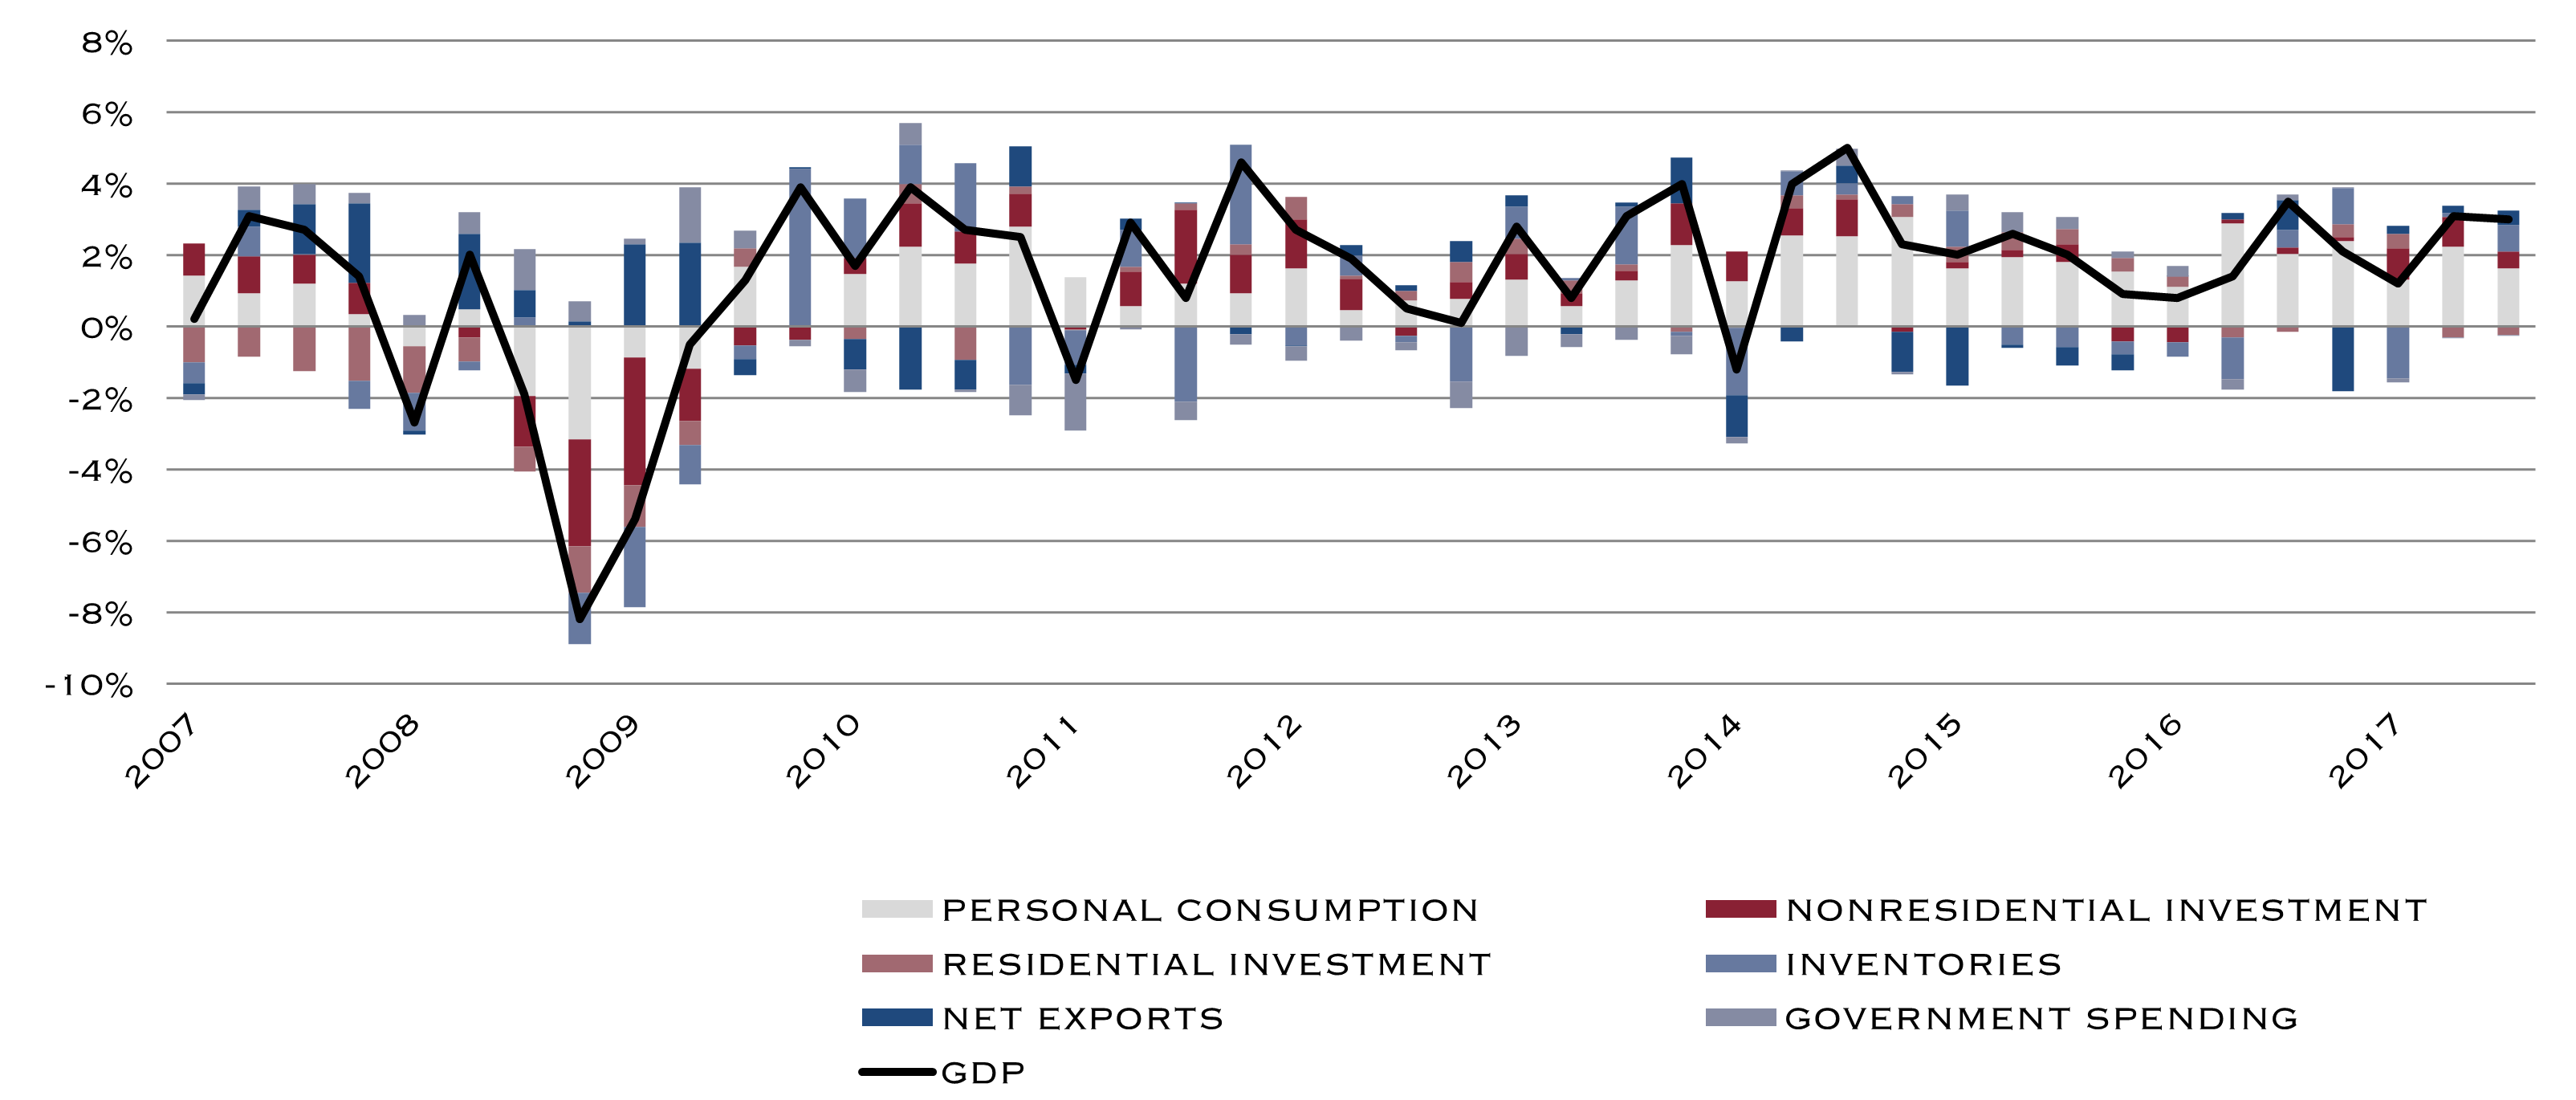
GDP Contributions
Quarterly

Source: BEA, as of September 30, 2017
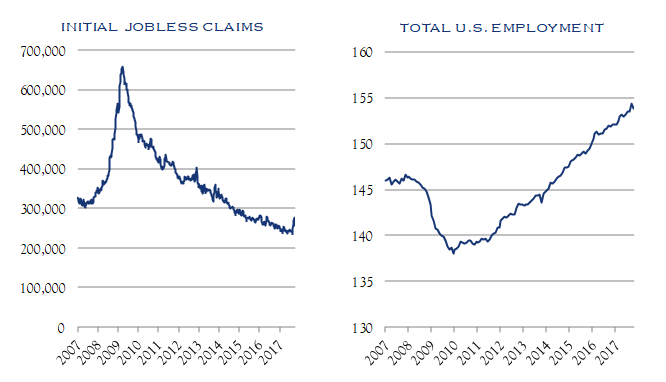
Economic growth continues at a slow and steady pace, with a variety of contributing factors. At the core has been personal consumption. For this reason, we maintain a close eye on the health of employment, charted in terms of unemployment rate and total number employed.
U.S. Employment
Millions employed, 16 years and older

Source: Bureau of Labor Statistics, as of October 2017
The continuation of modest expansion in the economy and the rise in business confidence has supported an expanding job market.
While recent figures have been a bit disrupted by the major storms impacting the south, total U.S. employment continues to grow. There has been much attention paid to the relatively low unemployment rate as well as the participation rate; both play a key role in assessing whether or when wage inflation will accelerate. The emergence of improved productivity is another factor in considering possible wage inflation.
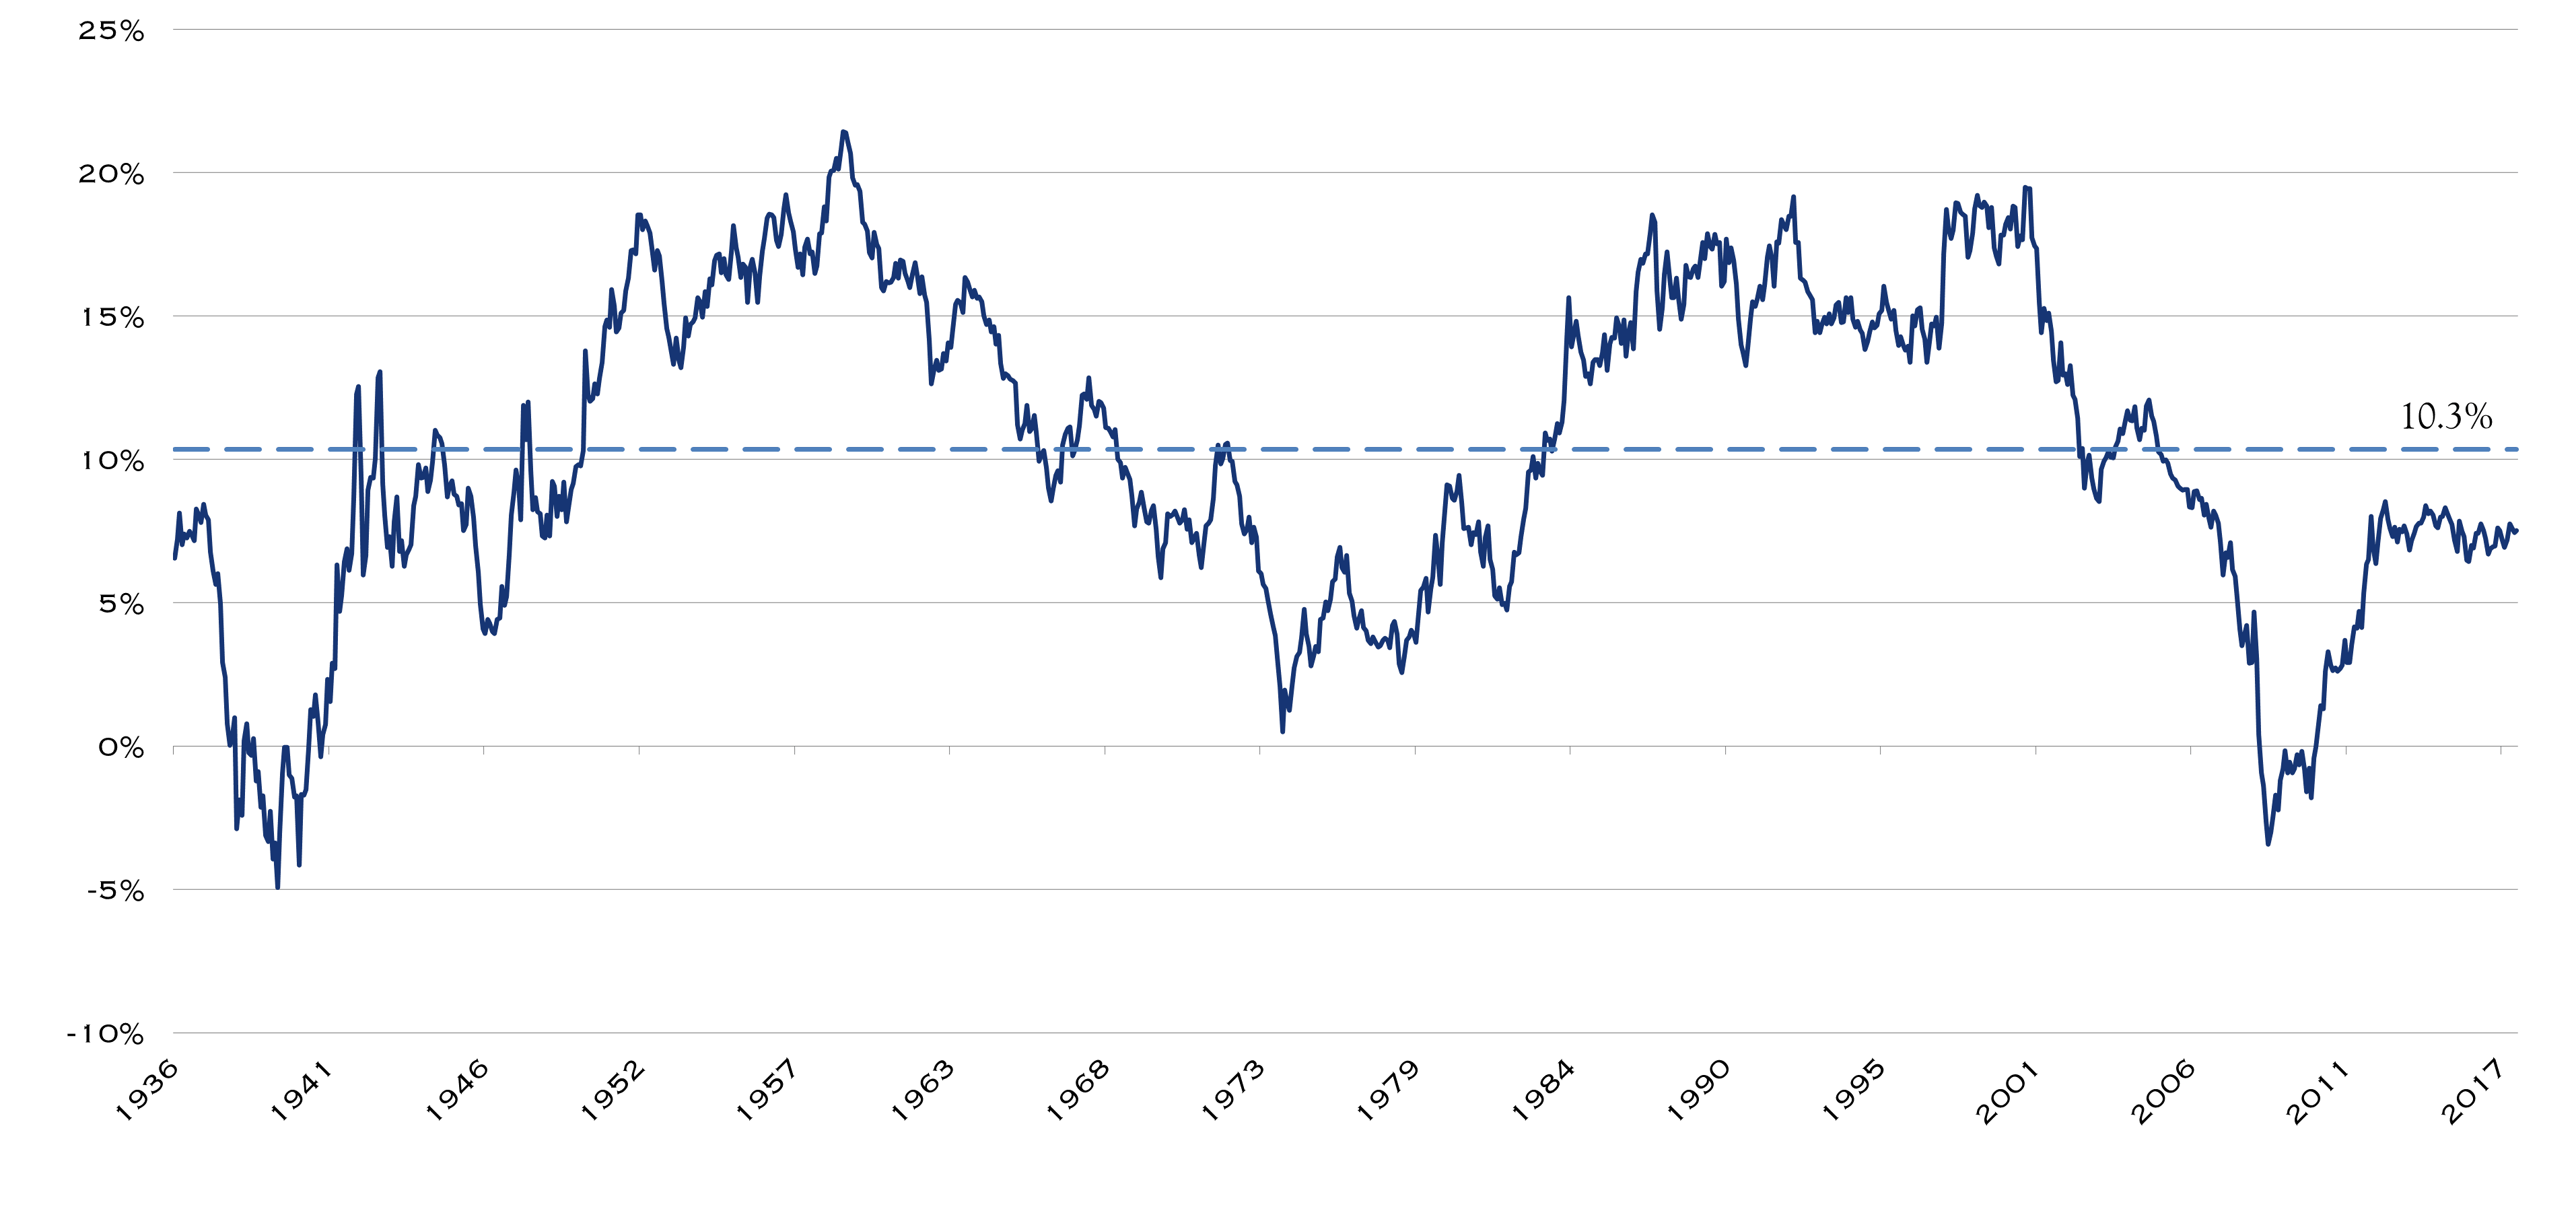
S&P 500 Total Return Index
Rolling 10-Year Return

Source: Bloomberg, as of October 31, 2017
It is instructive to review returns over a long-term horizon and to assess annualized returns on a rolling basis. As shown, the average 10-year annualized return for U.S. equities is 10.3% dating back to 1926. This is a good illustration of why equities play such a key role in long-term capital appreciation. Currently, while equities have recovered significantly following the 2008 financial crisis, 10-year returns remain below the long-term average. In large part, this is due to the very significant decline in 2008/2009. As those weak crisis-era returns drop out of the 10-year history, this profile will change. Another observation is that returns can remain well away from the average—either elevated or suppressed—for long stretches of time. While reversion to the mean does occur, it is not a clear or obvious timing tool. Finally, it can be observed that most of the time, returns over a 10-year horizon are positive.

Roger W. Vogel, CFA
Managing Director, Portfolio ManagerDiscovering Value Through Quality: Navigating the Equity Landscape
read the insight
Robert R. Teeter
Managing Director, Chief Investment StrategistA History of Market Declines
read the insight
Patrick Chovanec, CPA
Economic AdvisorInvestigating Inflation
read the insight
Christopher D. Brown, CFA
Portfolio ManagerUnderstanding the Endowment Model: Performance and Strategies for Complex Pools of Capital
read the insight
Patrick A. Bittner, CFA
Managing Director, Portfolio ManagerMunicipal Bond Update
read the insightInvestment Outlook Summary
The Investment Policy & Strategy Group met in October 2017 to review asset allocation.
Equity
Equity allocations were maintained at a level that is slightly above the midpoint of the allocation range across Income, Balanced and Growth Objectives. We maintain a constructive view of equities over the 2-4 year time horizon. We acknowledge that trailing PE ratios remain elevated as compared to long term averages. However, current levels of both rates and inflation are generally supportive of valuations. We maintain a vigilant watch for inflation, though a major bout does not appear imminent. Further, earnings growth has been positive thus far this year. As third quarter earnings season is just getting underway, we will keep a close eye on earnings.
We maintain a vigilant watch for inflation, though a major bout does not appear imminent.
While equities have experienced only minimal declines and volatility, it is important to remember that declines generally occur more frequently than has been the case in recent quarters. Fed Policy, the U.S. political climate and the global geopolitical environment remain as possible catalysts for increased volatility. As the equity market continues to advance, we strongly emphasize the importance of rebalancing and thoughtful deployment of cash.
Allocations across geography, market cap and investment style were maintained. Non-U.S. equity markets continue to exhibit strong performance and offer potential for compelling growth and valuation. Our allocation profile currently includes an allocation to non-U.S. investments. This allocation should be sized relative to portfolio objectives and investor domicile. We note that the appeal of non-U.S. markets can vary widely on a regional, country and sector level. Further, developed markets generally face long term challenges similar to the U.S. and often are quite correlated to U.S. equities.
Fixed Income
In fixed income, we observe that both rates and credit spreads remain at levels that are generally tight vs. history. Thus, we encourage prudence with regard to risks taken in those areas. Cash equivalents and fixed income alternatives are two strategies for limiting risk exposures in fixed income. Municipal bonds continue to provide some relative value for taxable investors.
In fixed income, we observe that both rates and credit spreads remain at levels that are generally tight vs. history.
Alternatives
Within alternatives, we continue to encourage specialization. Hedge fund results have improved in 2017. For more aggressive implementations, selective private equity, either in a core multi-strategy manner and/or through more aggressive venture capital or growth investing remain as options for seeking higher potential returns, albeit with higher potential investment risk, as well as the general risks of private investing. As with traditional equity, valuations are generally elevated, so selection is important.
Within alternatives, we continue to encourage specialization.
Conclusion
As always, we will seek to add value to client portfolios over time by rebalancing allocations in anticipation of opportunity or in reaction to market developments in order to maintain the proper balance between risk and opportunity.
Market Monitor
This table provides a comprehensive view of returns across various markets and time frames. It is paired with a snapshot of economic data at the start of each time frame. This allows for comparison of annualized returns for a time frame while referencing the basic economic conditions in place in various periods.

Source: Bloomberg, data as of 10/31/2017. U.S. GDP, CPI, and Unemployment figures are as of 9/30/2017.


